Purpose
#Todo
COVID-19 was discovered from December 2019 in Wuhan, Hubei Province, China. The virus mutates by continuously adapting to the host and, when symptoms are severe, can lead to death in patients infected with COVID-19. Economically, the emergence of COVID-19 has dealt an unprecedented blow to the global economy. By analysing the number of people infected with COVID-19 and vaccinated against COVID-19 in each country and region over a specific period of time, the project will help companies to cope with the impact of COVID-19 by analysing current trends in the epidemic.
Data Source
Dataset 1:
- Source Name: owid-covid-data(JSON)
- Source description: This data is aggregated for 226 countries from January 2020 to May 2021 due to COVID-19.
- Link To Source(original data): https://covid.ourworldindata.org/data/owid-covid-data.json
Dataset 2:
- Source Name: Coronavirus COVID-19 Vaccinations(CSV)
- Source description: This data is a count of COVID-19 vaccinations in 237 countries for the period December 2020 to May 2022.
- Link To Source(original data): https://data.humdata.org/dataset/covid-19-vaccinations
Datasets
第一个数据集是owid-covid-data.json,来源于xxxxx。该数据集包含了226个国家的新冠感染情况数据、疫苗接种等相关数据,字段包含:“location”“iso_code”“reproduction_rate”“total_tests”“weekly_icu_admissions”“new_deaths_per_million”“total_cases_per_million”“new_deaths”“icu_patients”“weekly_hosp_admissions”“people_fully_vaccinated_per_hundred”“excess_mortality_cumulative_per_million”“total_deaths_per_million”“people_vaccinated”“new_cases”“icu_patients_per_million”“new_cases_smoothed”“total_cases”“total_tests_per_thousand”“hosp_patients”“total_boosters”“positive_rate”“new_tests_per_thousand”“total_vaccinations”“weekly_icu_admissions_per_million”“new_vaccinations”“new_tests”“new_deaths_smoothed”“new_people_vaccinated_smoothed_per_hundred”“people_fully_vaccinated”“tests_units”“new_people_vaccinated_smoothed”“hosp_patients_per_million”“new_deaths_smoothed_per_million”“excess_mortality_cumulative”“tests_per_case”“new_cases_smoothed_per_million”“total_deaths”“date”“people_vaccinated_per_hundred”“new_vaccinations_smoothed_per_million”“weekly_hosp_admissions_per_million”“new_tests_smoothed”“excess_mortality_cumulative_absolute”“total_vaccinations_per_hundred”“stringency_index”“new_cases_per_million”“new_tests_smoothed_per_thousand”“new_vaccinations_smoothed”“total_boosters_per_hundred”“excess_mortality”
第二个数据集是Coronavirus (COVID-19) Vaccinations.csv,来源于xxxxx。该数据集包含了237个国家在2020年12月至2022年五月的新冠疫苗接种相关数据,其字段包含:“location”“iso_code”“date”“total_vaccinations”“people_vaccinated”“people_fully_vaccinated”“total_boosters“”daily_vaccinations_raw“”daily_vaccinations“”total_vaccinations_per_hundred“”people_vaccinated_per_hundred“”people_fully_vaccinated_per_hundred“”total_boosters_per_hundred“”daily_vaccinations_per_million“”daily_people_vaccinated“”daily_people_vaccinated_per_hundred“
Process
本项目首先针对原始的owid-covid-data.json数据文件进行了拆解,由于文件过大(纯文本超过120MB),因此使用Python进行关键信息的提取。由于我们想要研究某些时间段内不同国家和区域之间的新冠疫苗接种情况和新冠感染数量,所以我们要关注这个数据集中的data中的内容。根据其我们使用的文件结构可知,他是一个嵌套json(Nested JSON),同时我们可以知道data是一个其中的一个子对象(sub object),该子对象包含了这个国家所有所有日期的相关数据,要想把它提取到csv中,需要我们将它和非嵌套内容并列排布,因此我使用了python来完成这一点,具体的操作将在后面的Wrangling Details部分详细描述。同时,我并不关注非嵌套内容中关于国家相关的诸如“population_density”,”population”等数据,因此在处理时并不提取这部分内容的数据。在“data”中我们需要关注脏数据,比如”test_unit”字段,表示测试内容,并没有实际意义,在提取的时候需要删除,只提取我们关注的数据进行分析。
然后针对Coronavirus (COVID-19) Vaccinations.csv,我们删除了第二行无意义的文本内容,这些内容可能会导致后续分析的出错,并且针对其中可能出现的全部内容为空的字段和重复值的字段进行了检查,删除了这些潜在的可能导致出错的字段。
最后我们将通过python转换后的csv和原始csv文件在excel中进行合并。转换后的csv字段是包含原始csv文件的字段的,由于在最开始处理json为csv时,已经将两个文件字段顺序调整为一致,所以我们只需要简单地将两个文件在excel中进行复制和粘贴就可以完成合并。
合并后的文件具有超过200个国家的新冠疫苗接种数据、新冠感染、死亡相关数据,时间范围从2020年2月至2022年4月。我们基于此合并后的文件进行了问题的分析。
Wrangling Details
- json转换为csv
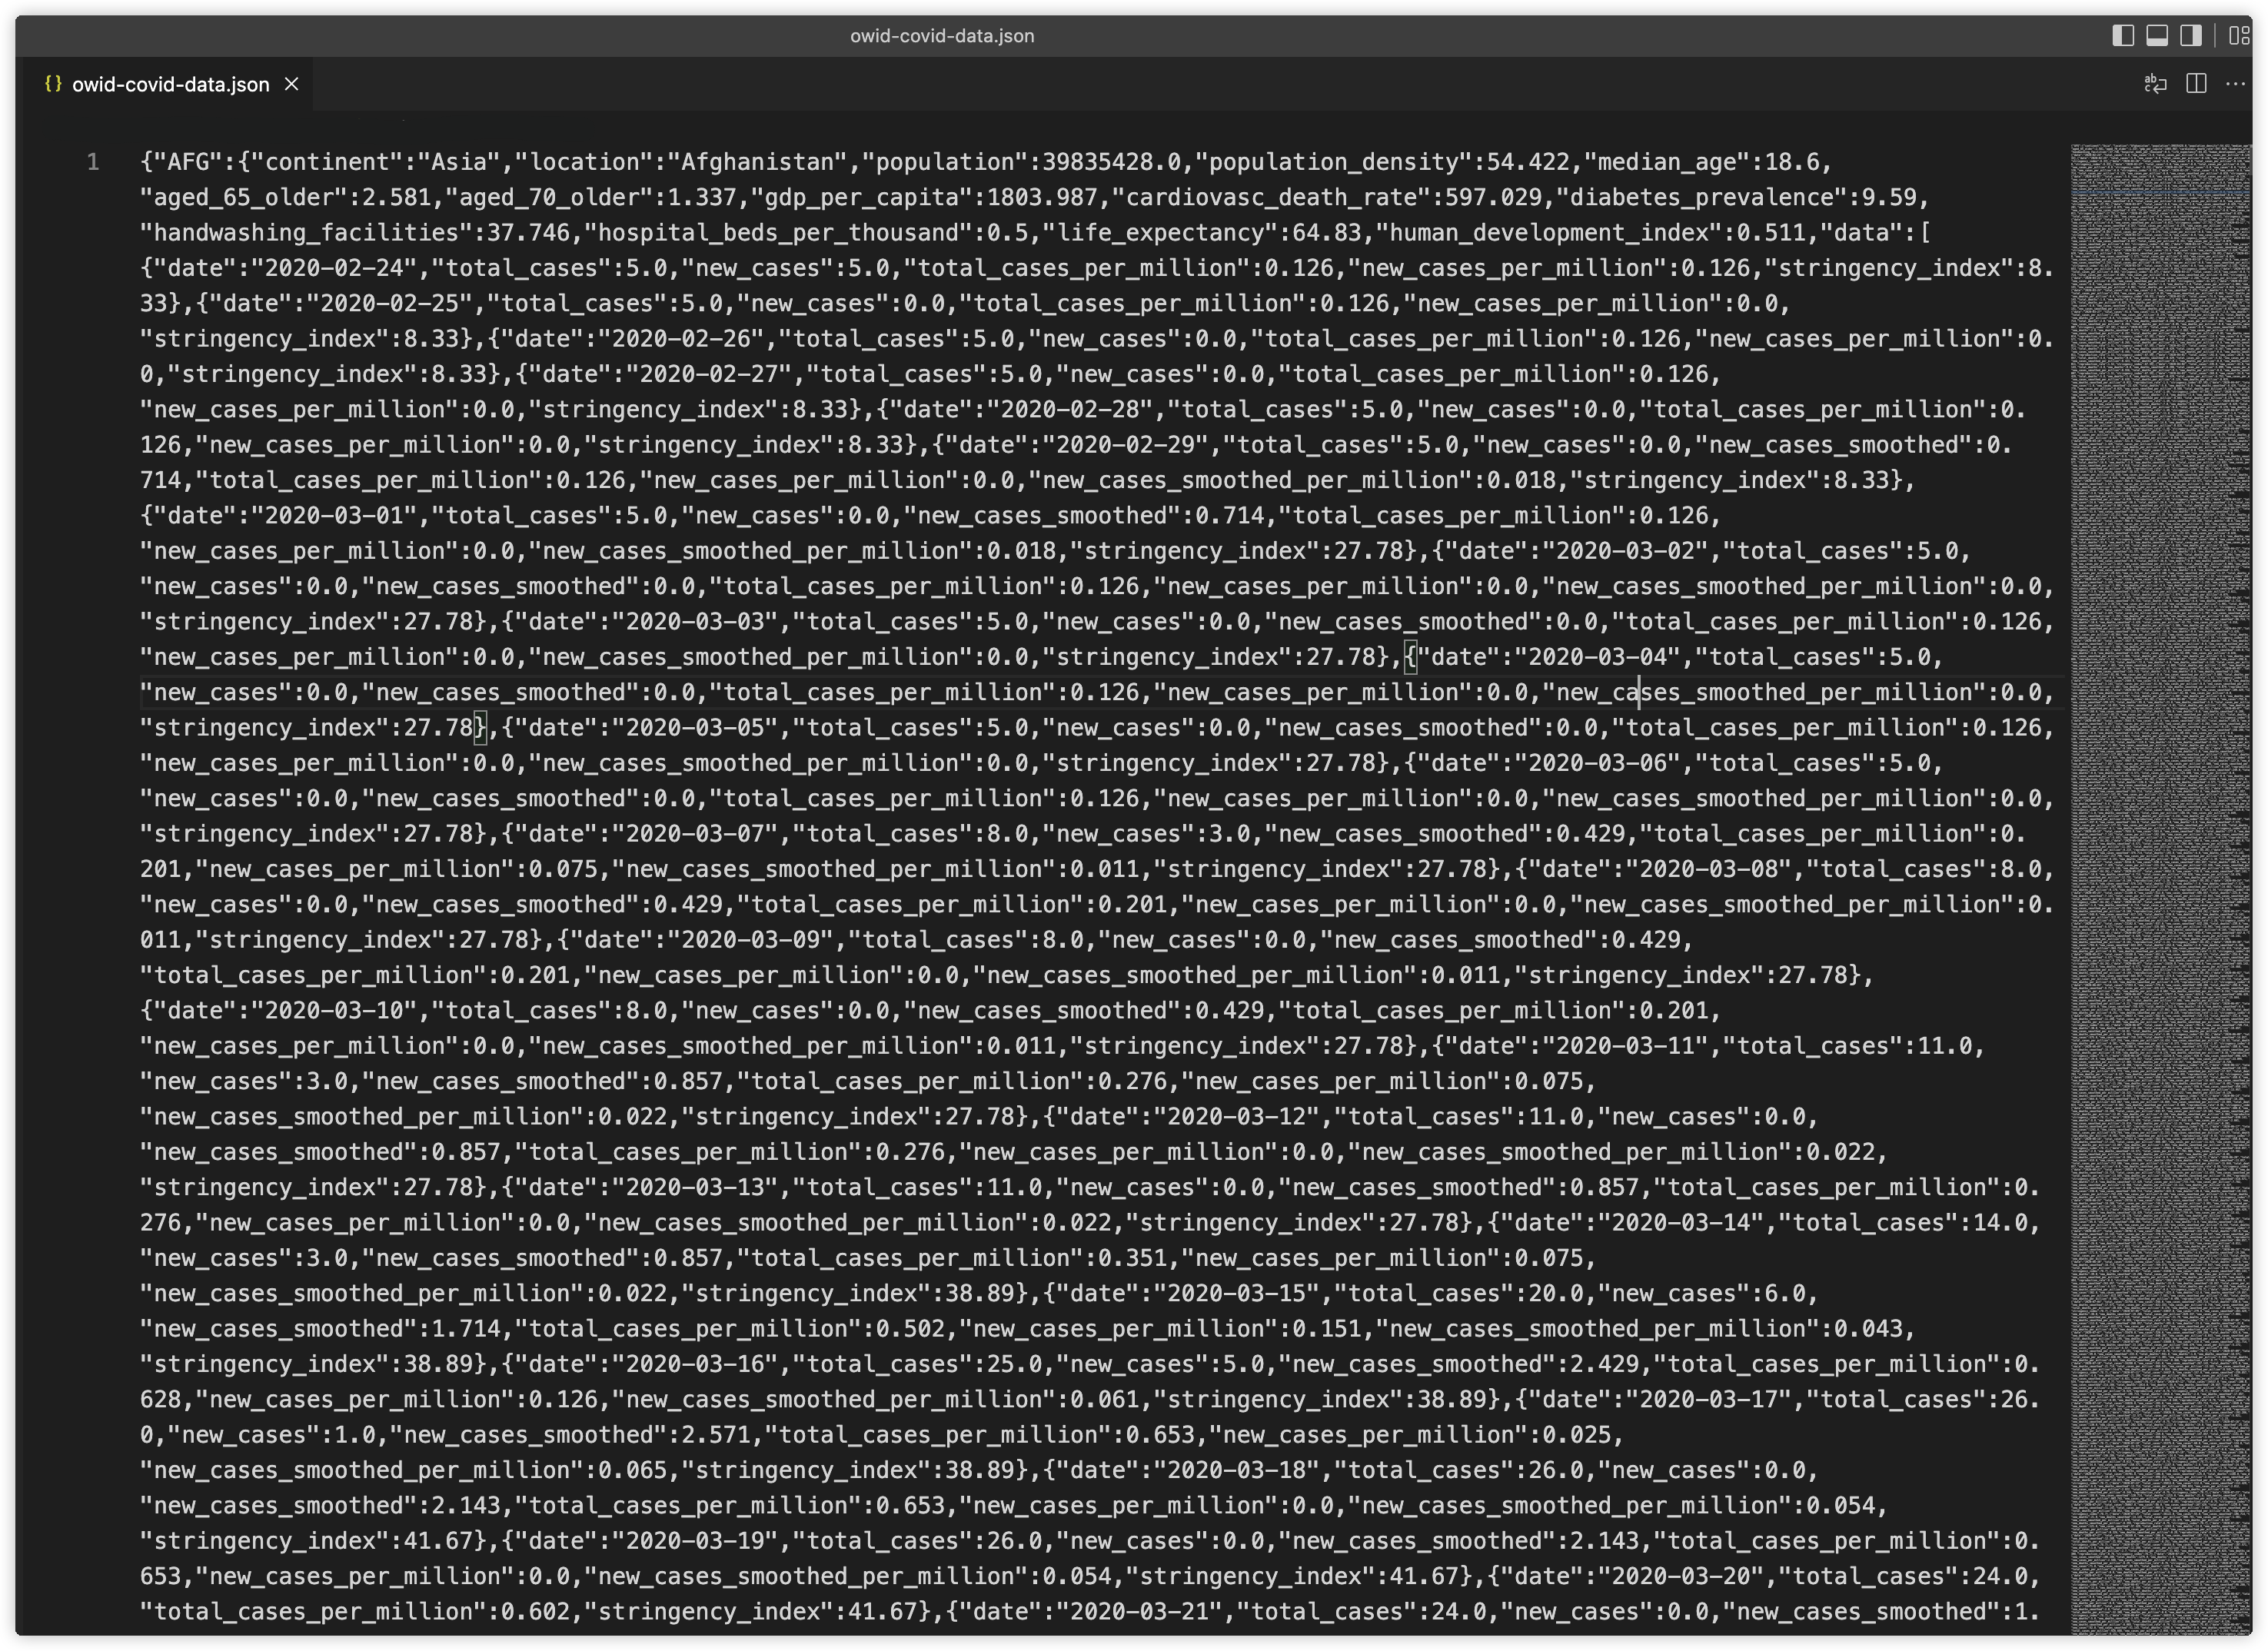
The raw dataset is in JSON format. The type of the dataset is cross-sectional. 在vscode中打开可以看到json文件内容如下:
We use command line of mongodb to import the file “owid-covid-data.json”. First we need to go to the path where the data file is located, and then excute the following command.
mongoimport --d owid -c collection --file /Users/liuxinhui/Desktop
/owid-covid-data.json
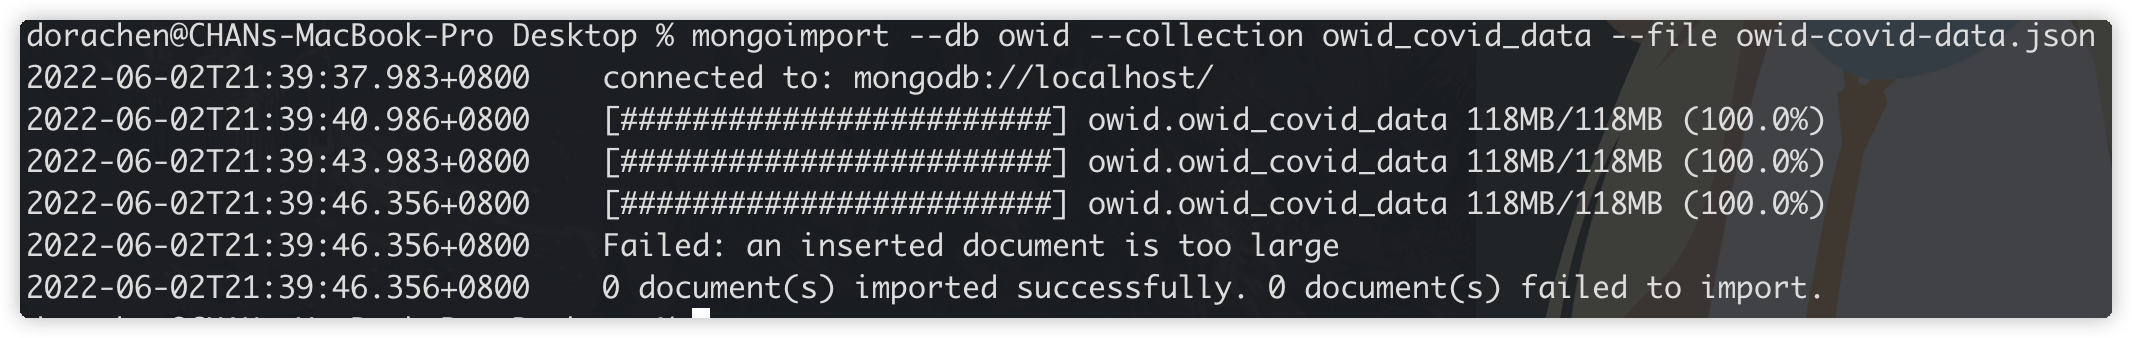
As you can find that we get an error message that the inserted document is too large(Approximately 124MB). It is known that MongoDB stores in BSON (Binary JSON
) and the maximum BSON document size is 16MB.因此直接导入我们选择的json文件到mongodb中进行分析是不太可能完成的,我们需要将json文件转换为csv后进行导入。
json文件大的原因之一是因为数据量太大,过多的冗余信息会对我们的问题分析造成困难,因此我们在json转换csv文件的时候,只对我们需要的字段信息进行提取,根据json的原始数据我们进行过滤,根据我们需要分析的数据,过滤后的字段应该包括:
“location“”iso_code“”continent“”date“”total_vaccinations“”people_vaccinated“”people_fully_vaccinated“”total_boosters“”new_vaccinations“”total_vaccinations_per_hundred“”people_vaccinated_per_hundred“”people_fully_vaccinated_per_hundred“”total_boosters_per_hundred“”new_vaccinations_smoothed_per_million“”new_people_vaccinated_smoothed“”new_people_vaccinated_smoothed_per_hundred“”new_cases“”new_cases_per_million“”new_cases_smoothed“”new_cases_smoothed_per_million“”total_cases“”total_cases_per_million“”icu_patients“”icu_patients_per_million“”new_deaths“”new_deaths_per_million“”new_deaths_smoothed“”new_deaths_smoothed_per_million“”total_deaths“”total_deaths_per_million”
根据上面的需求,我的Python代码编写如下:
import json
import csv

JSON_DATA_FILE = 'owid-covid-data.json'
OUTPUT_CSV_FILE = 'owid-covid-data.csv'


def process_csv():
    # read in json data
    with open(JSON_DATA_FILE) as fin:
        data_in = json.load(fin)

    # get all statistical indicators of the data from each day
    # indicators = set()
    # for country in data_in.keys():
    #     for day in data_in[country]['data']:
    #         indicators.update(day.keys())
    # # sort the indicators alphabetically
    #
    # indicators.remove('date')

    # for each day in each country,
    # record the data of each indicator
    indicators = ['date', 'total_vaccinations', 'people_vaccinated', 'people_fully_vaccinated', 'total_boosters',
                  'new_vaccinations', 'total_vaccinations_per_hundred', 'people_vaccinated_per_hundred',
                  'people_fully_vaccinated_per_hundred', 'total_boosters_per_hundred',
                  'new_vaccinations_smoothed_per_million', 'new_people_vaccinated_smoothed',
                  'new_people_vaccinated_smoothed_per_hundred',

                  'new_cases', 'new_cases_per_million', 'new_cases_smoothed', 'new_cases_smoothed_per_million',
                  'total_cases', 'total_cases_per_million',
                  'icu_patients', 'icu_patients_per_million',
                  'new_deaths', 'new_deaths_per_million', 'new_deaths_smoothed', 'new_deaths_smoothed_per_million',
                  'total_deaths', 'total_deaths_per_million',

                  ]
    csv_header = ['location', 'iso_code', 'continent'] + indicators
    csv_body = []
    for country in data_in.keys():
        for day in data_in[country]['data']:
            # extract data for the fixed indicators
            location = data_in[country].get('location')
            iso_code = country
            continent = data_in[country].get('continent')

            # data for other indicators
            csv_row = [location, iso_code, continent]
            csv_row += [day.get(i) for i in indicators]
            csv_body.append(csv_row)

    # output
    with open(OUTPUT_CSV_FILE, 'w+', newline='') as fout:
        output = csv.writer(fout)
        output.writerow(csv_header)
        output.writerows(csv_body)


if __name__ == '__main__':
    process_csv()$
该Python程序运行在PyCharm IDE中,主要使用了json和csv两个库。在process_csv主函数中,我们首先读取了json文件到data_in列表(list)中:
data_in = json.load(fin)
然后我们将我们上文提到的所关注的字段指标(indicators)列为列表,这些indicators都是在json文件中data字段里存在的,是嵌套内容。然后我们让csv_header表格头为非嵌套内容的’location’’iso_code’’continent’以及之前所提到的indicators。
csv_header = ['location', 'iso_code', 'continent'] + indicators
然后我们进行循环遍历,对原始json数据中的每个country,它们中嵌套包含的data,获取data中对应的indicators的数据,同时也获取非嵌套数据的location、continent数据,把他们通过append函数添加到csv_body的数据主体中。
    for country in data_in.keys():
        for day in data_in[country]['data']:
            # extract data for the fixed indicators
            location = data_in[country].get('location')
            iso_code = country
            continent = data_in[country].get('continent')

            # data for other indicators
            csv_row = [location, iso_code, continent]
            csv_row += [day.get(i) for i in indicators]
            csv_body.append(csv_row)
最后获得了csv表头与表体,我们进行文件的写入:
output = csv.writer(fout)
output.writerow(csv_header)
output.writerows(csv_body)
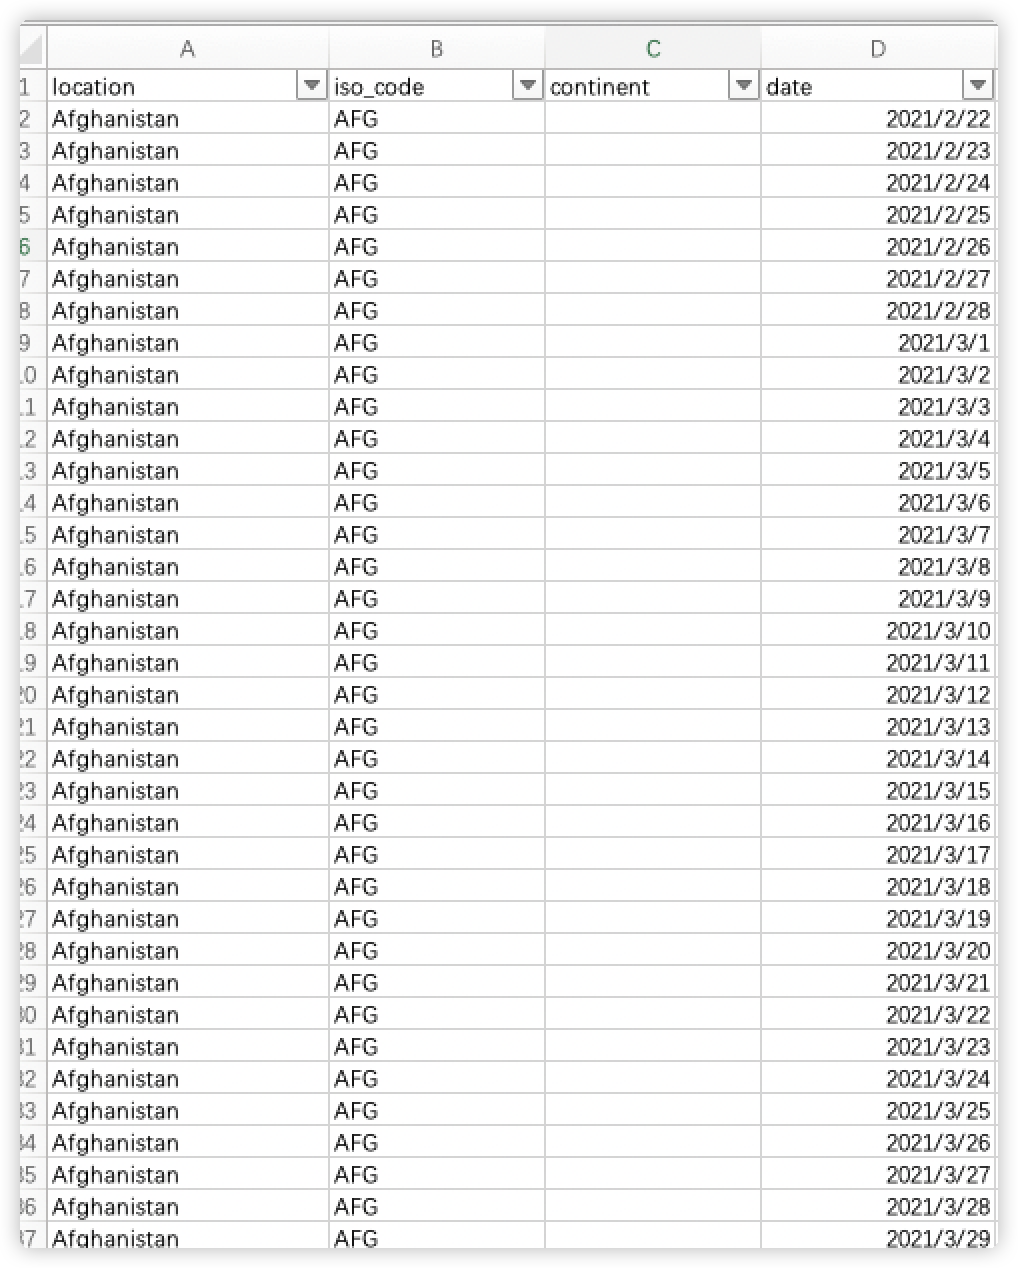
至此我们的json文件成功转换为了csv文件,该文件具有约26MB的大小。经过转换处理后的csv文件如下:

转换后的csv是标准的,可以直接在excel中打开或者导入mongodb进行分析。
- csv文件的预处理
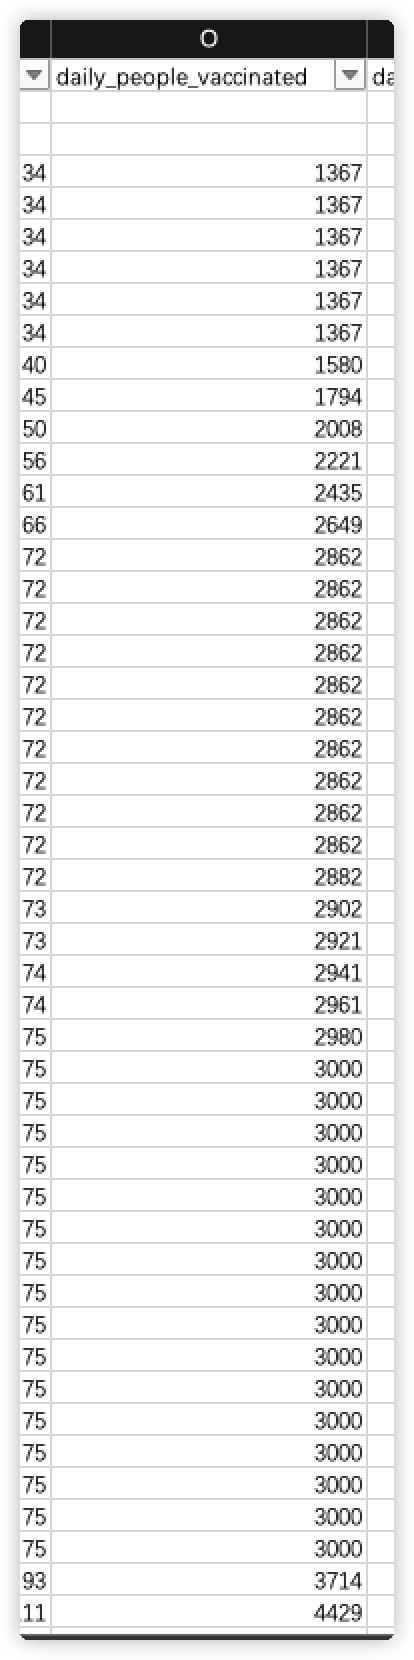
在此步骤中,我们对原始的csv文件进行了预处理。首先我们发现原始csv文件中第二行数据是没有意义的,因此我们选中该行并且删除。

然后我们发现,csv文件中daily_vaccinations和daily_people_vaccinated两个字段是重复的,因此我们删除了dalily_vaccinations字段。

然后我们为了与json转换后的csv文件合并,我们发现原始csv文件中缺少continent字段,因此在iso_code后添加一个continent列,以保持与json转换后文件的字段的一致性,使得后续的合并操作能够进行。
- 合并json与csv
由于在步骤1中我们已经将json转换为了csv文件,并且步骤2保持了字段的一致性,两个csv文件内容如下:
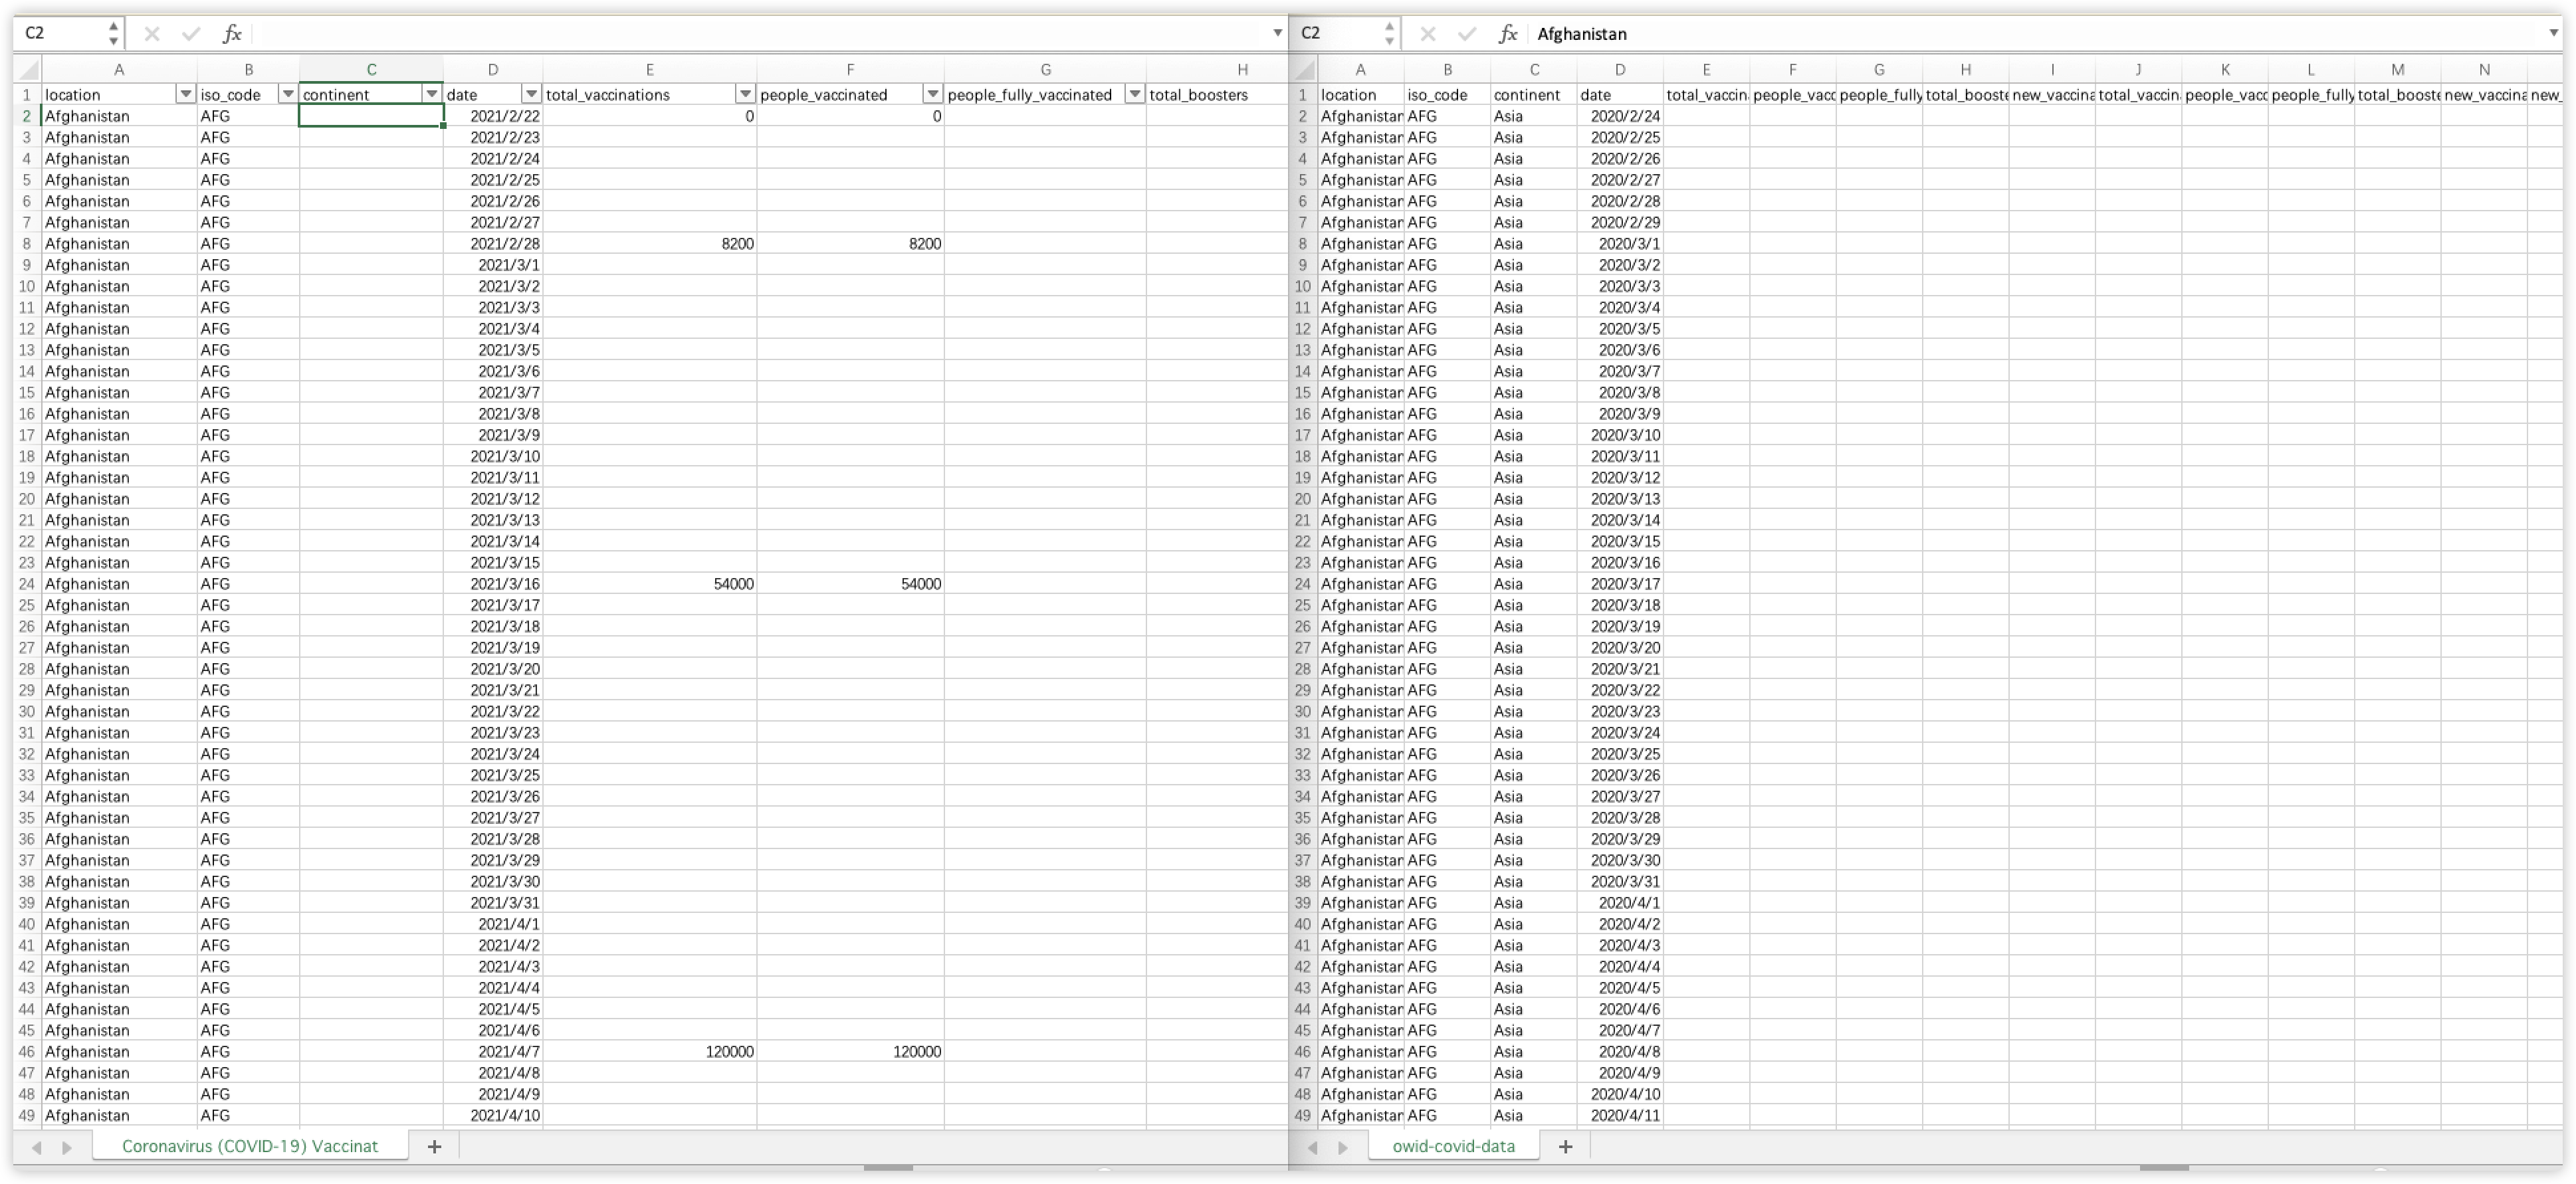
因此我们可以直接简单地复制和粘贴,将两个csv文件进行合并,合并后的文件如下:

该文件我们命名为combine.csv,并且另存一个副本为combine.xslx
- 导入数据至mongodb
我们使用Studio 3T其导入combine.csv文件至mongodb:

我们点击Run进行导入,导入成功后会有一个combine的collection。我们在mongodb中执行查询和count命令,可以看到最终导入了281900条记录(records)。
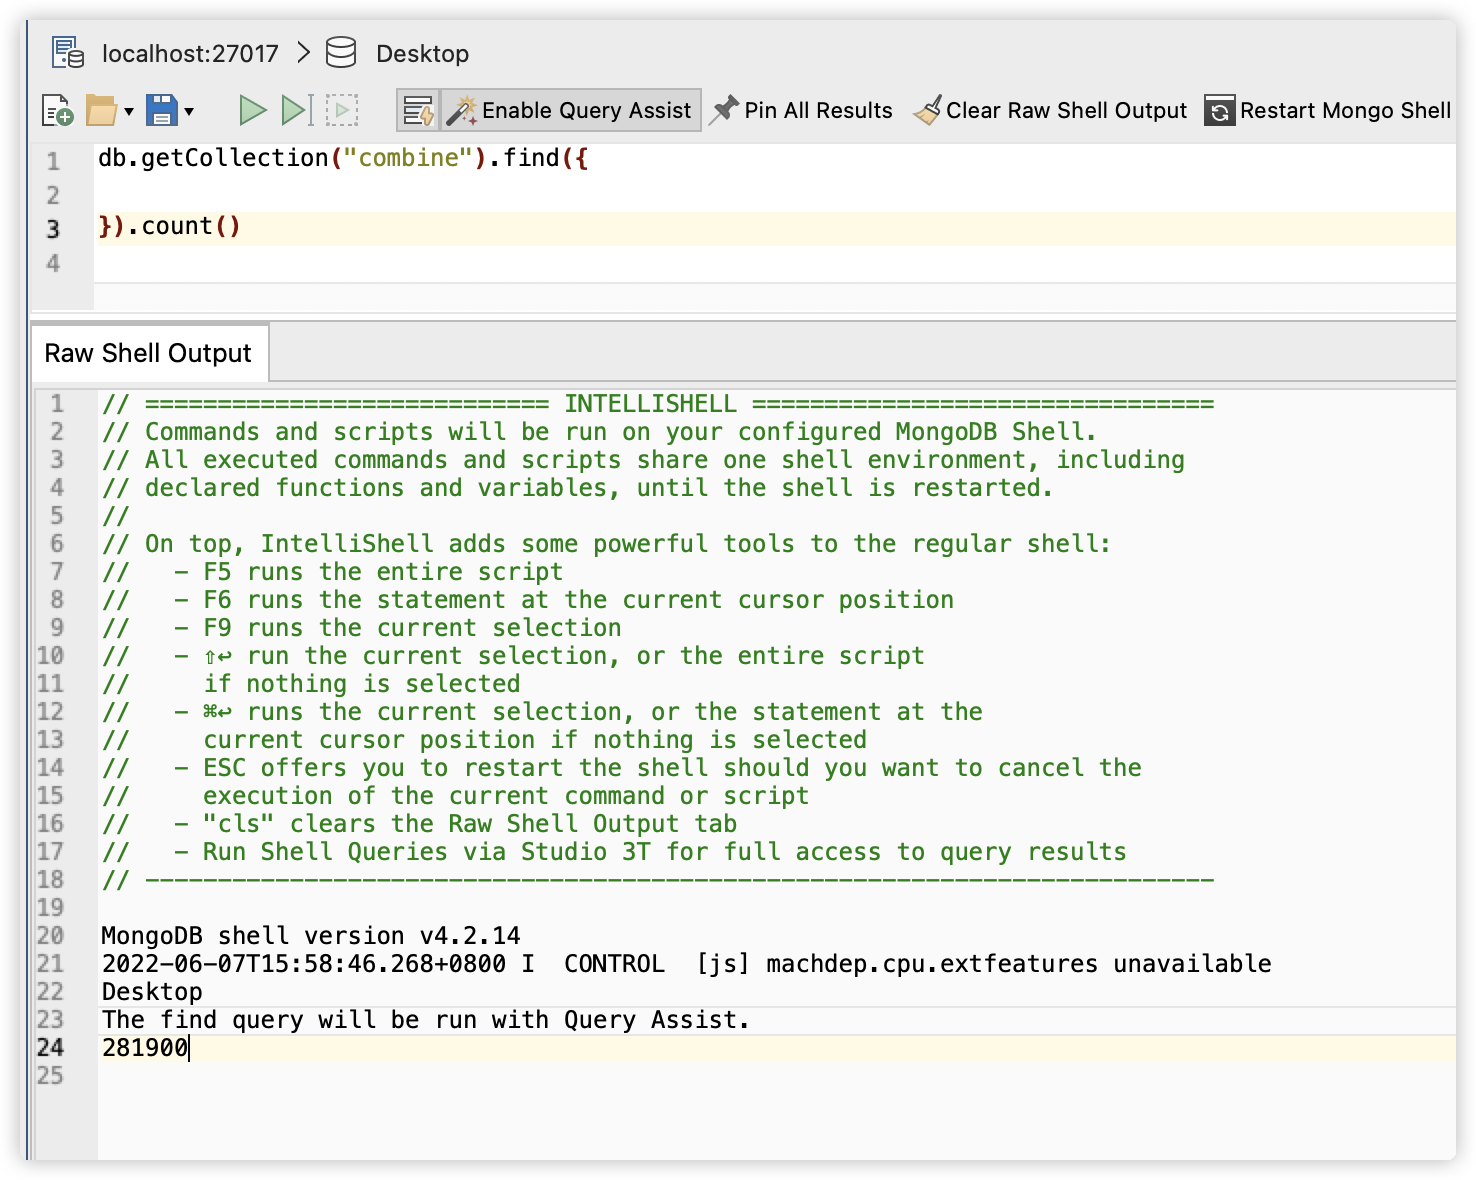
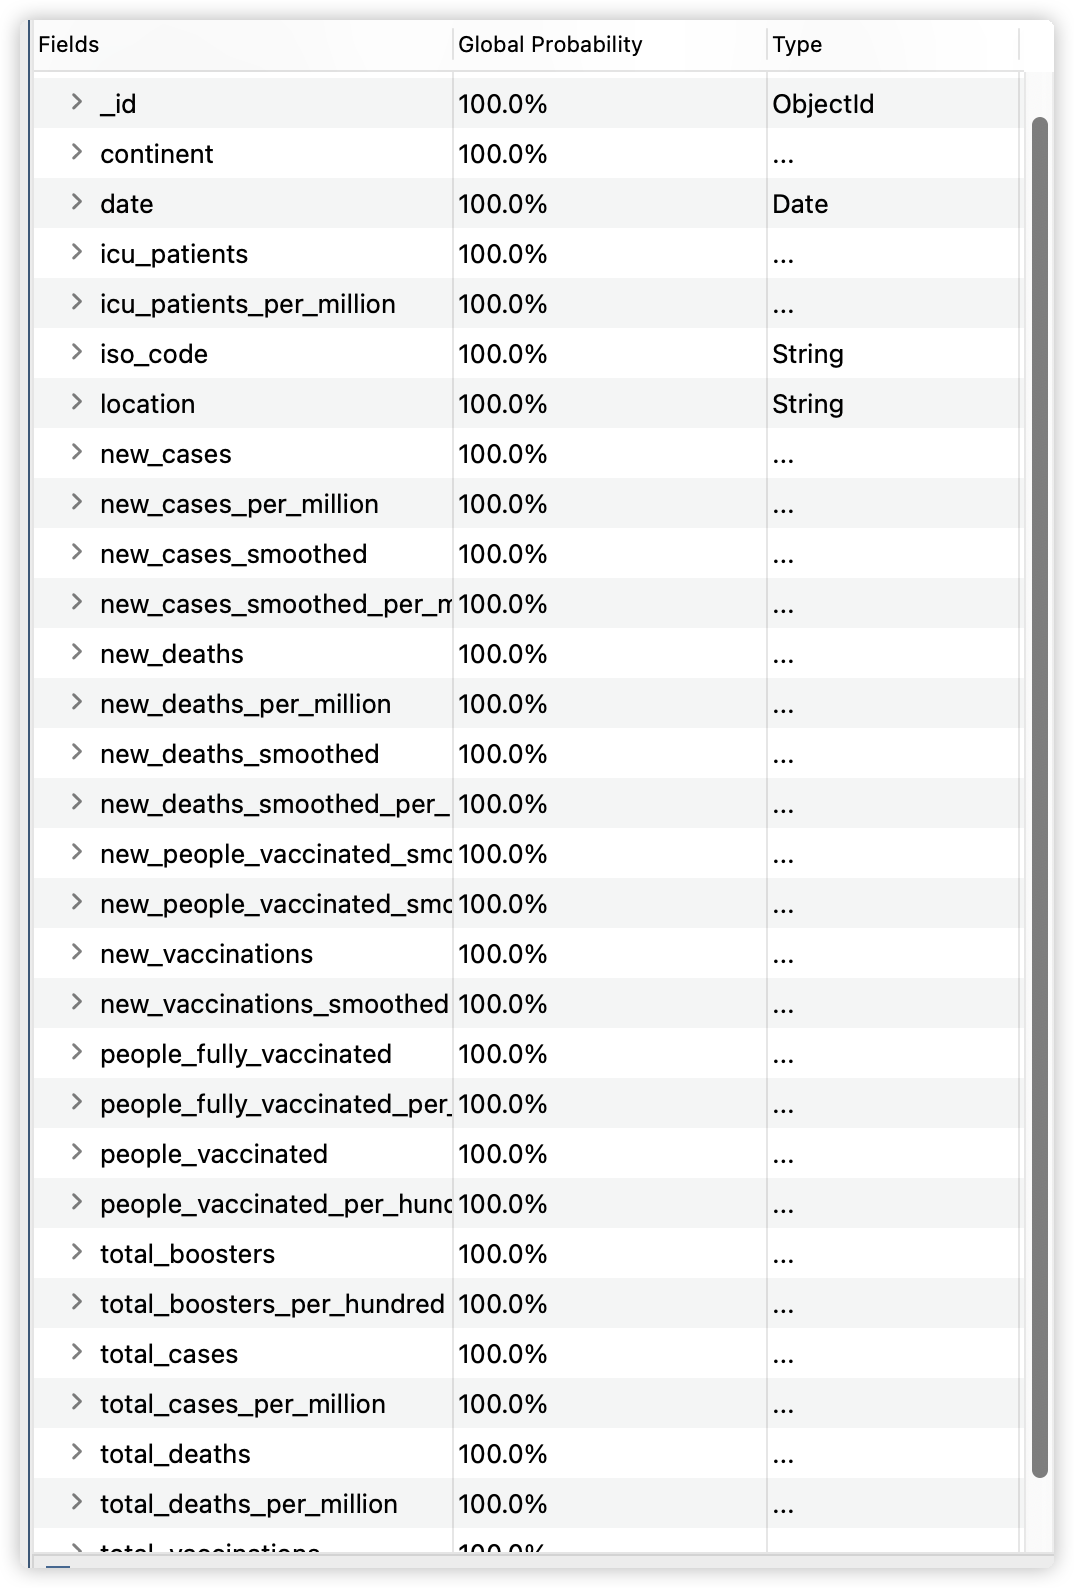
每个record有31个fields。
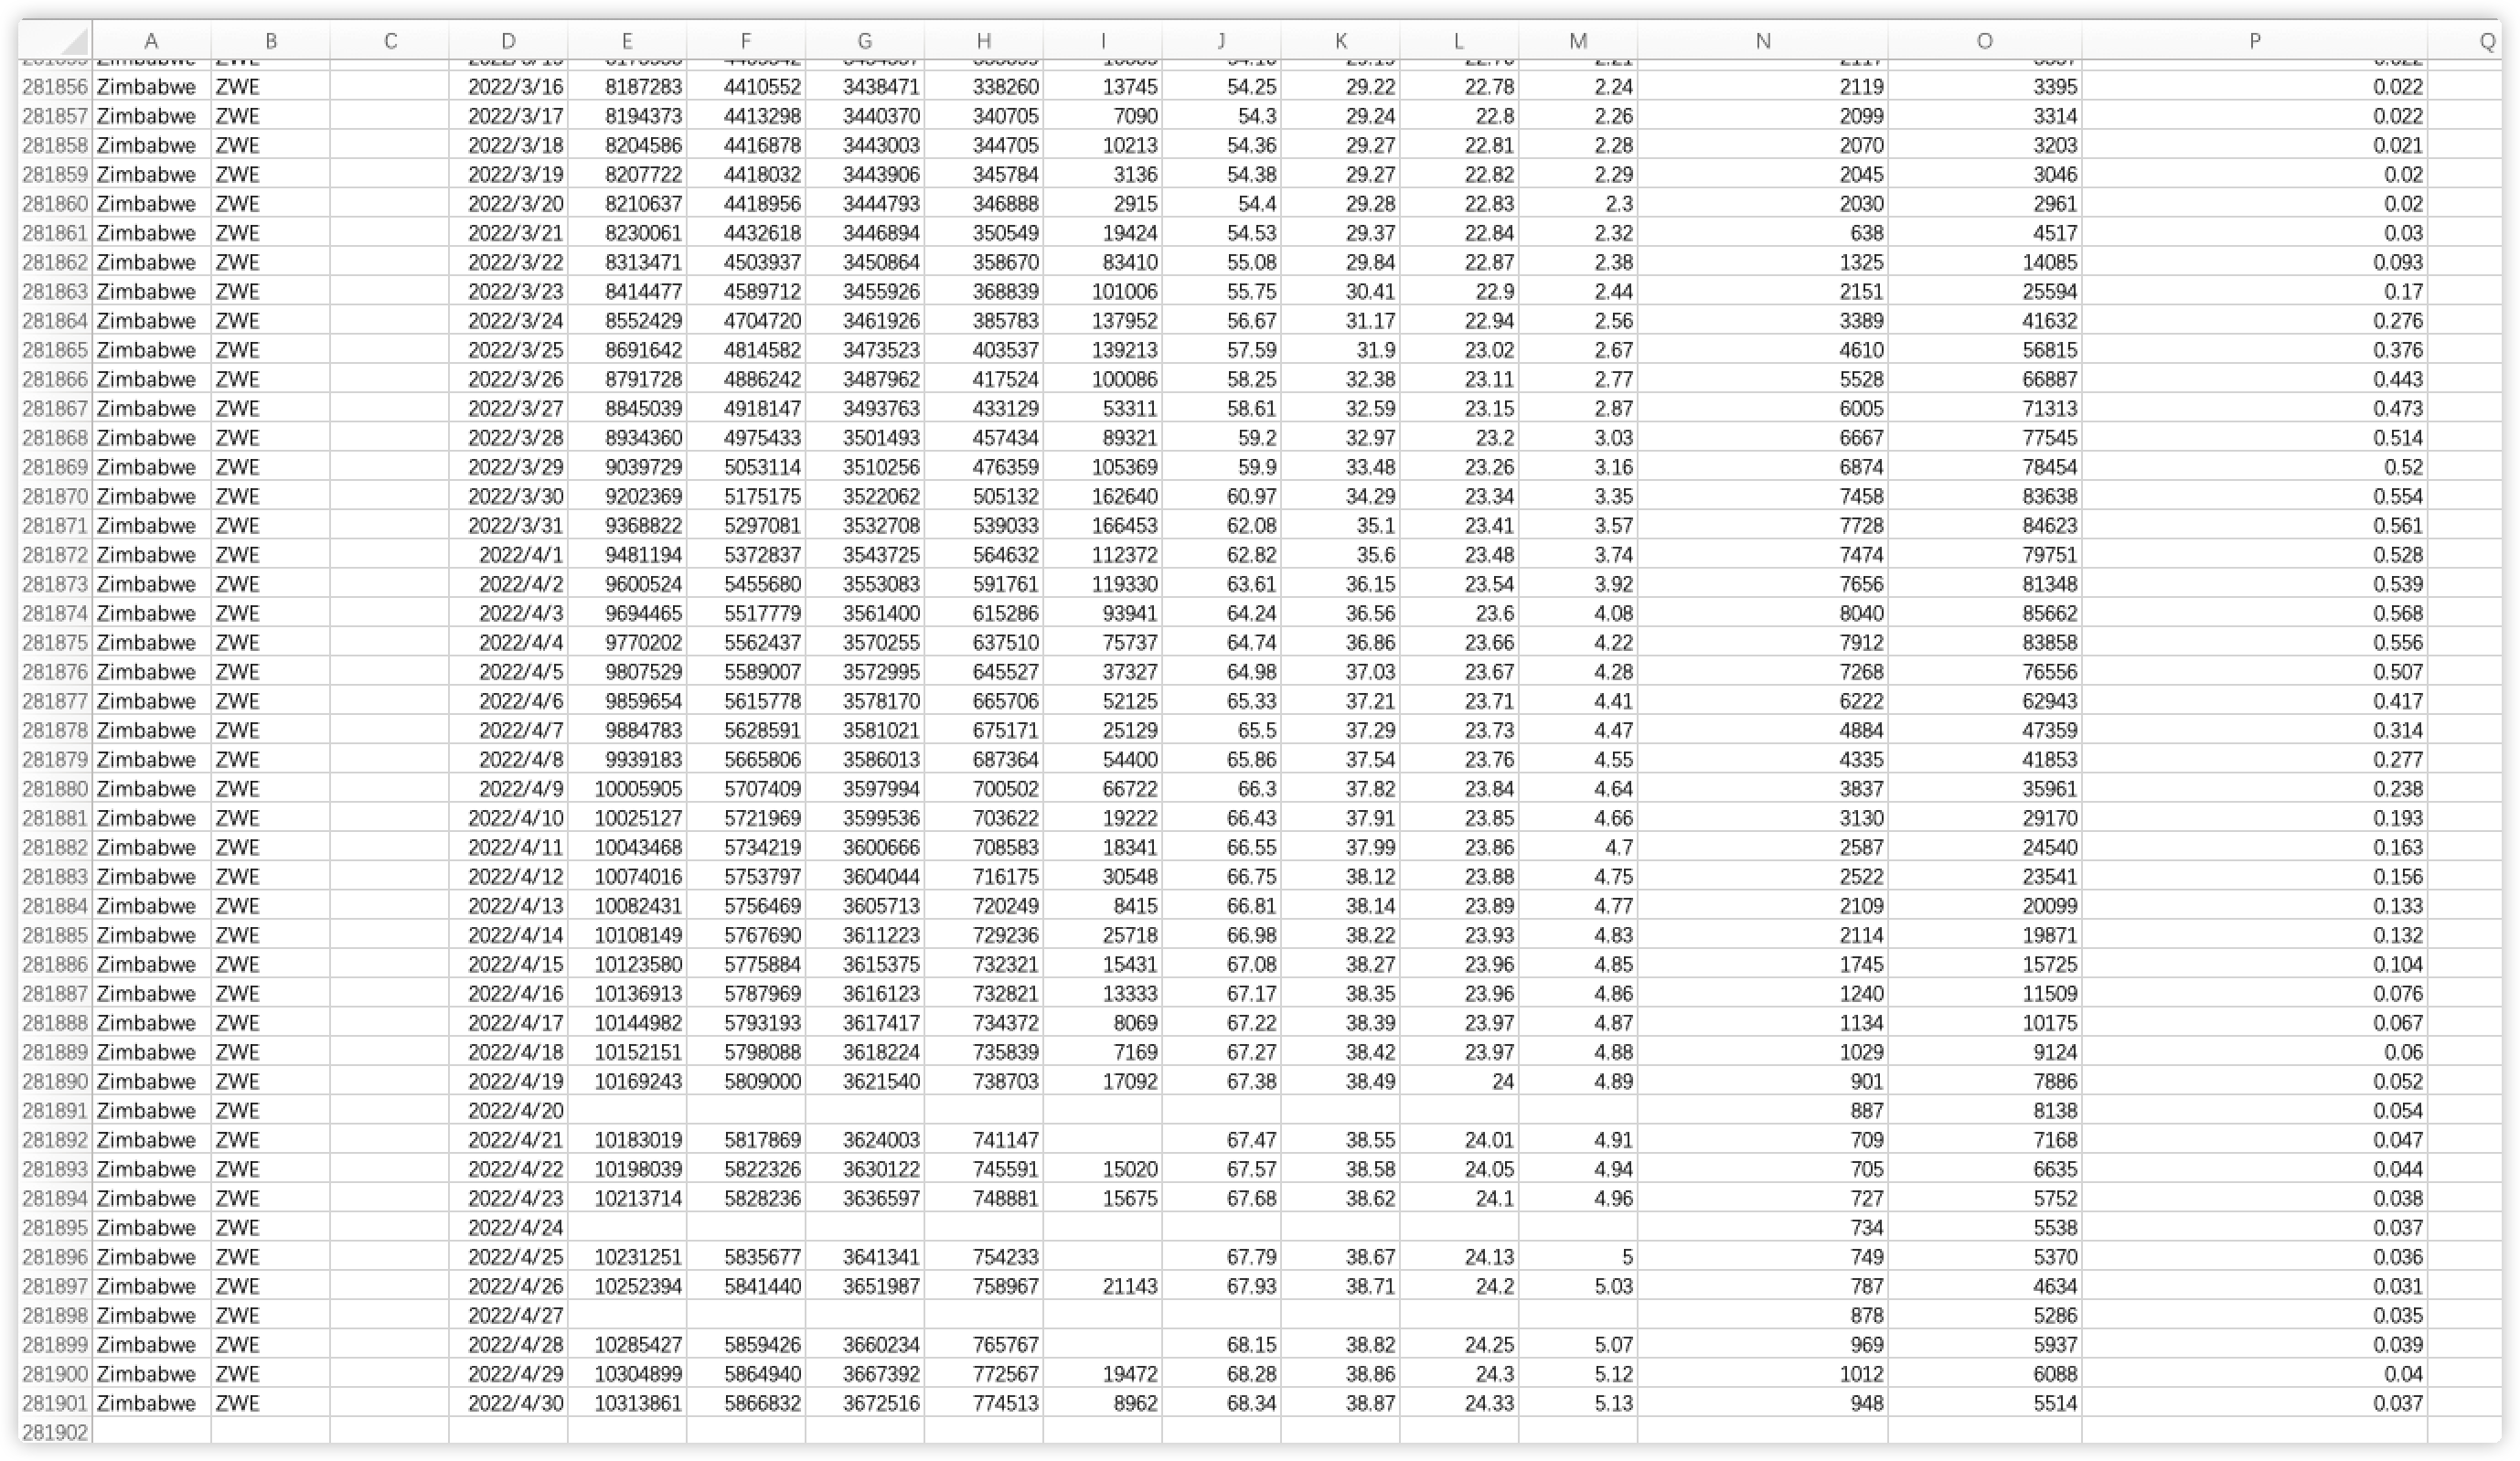
同时,我们在excel中打开combine.xslx,可以查看到有281901行,31列。
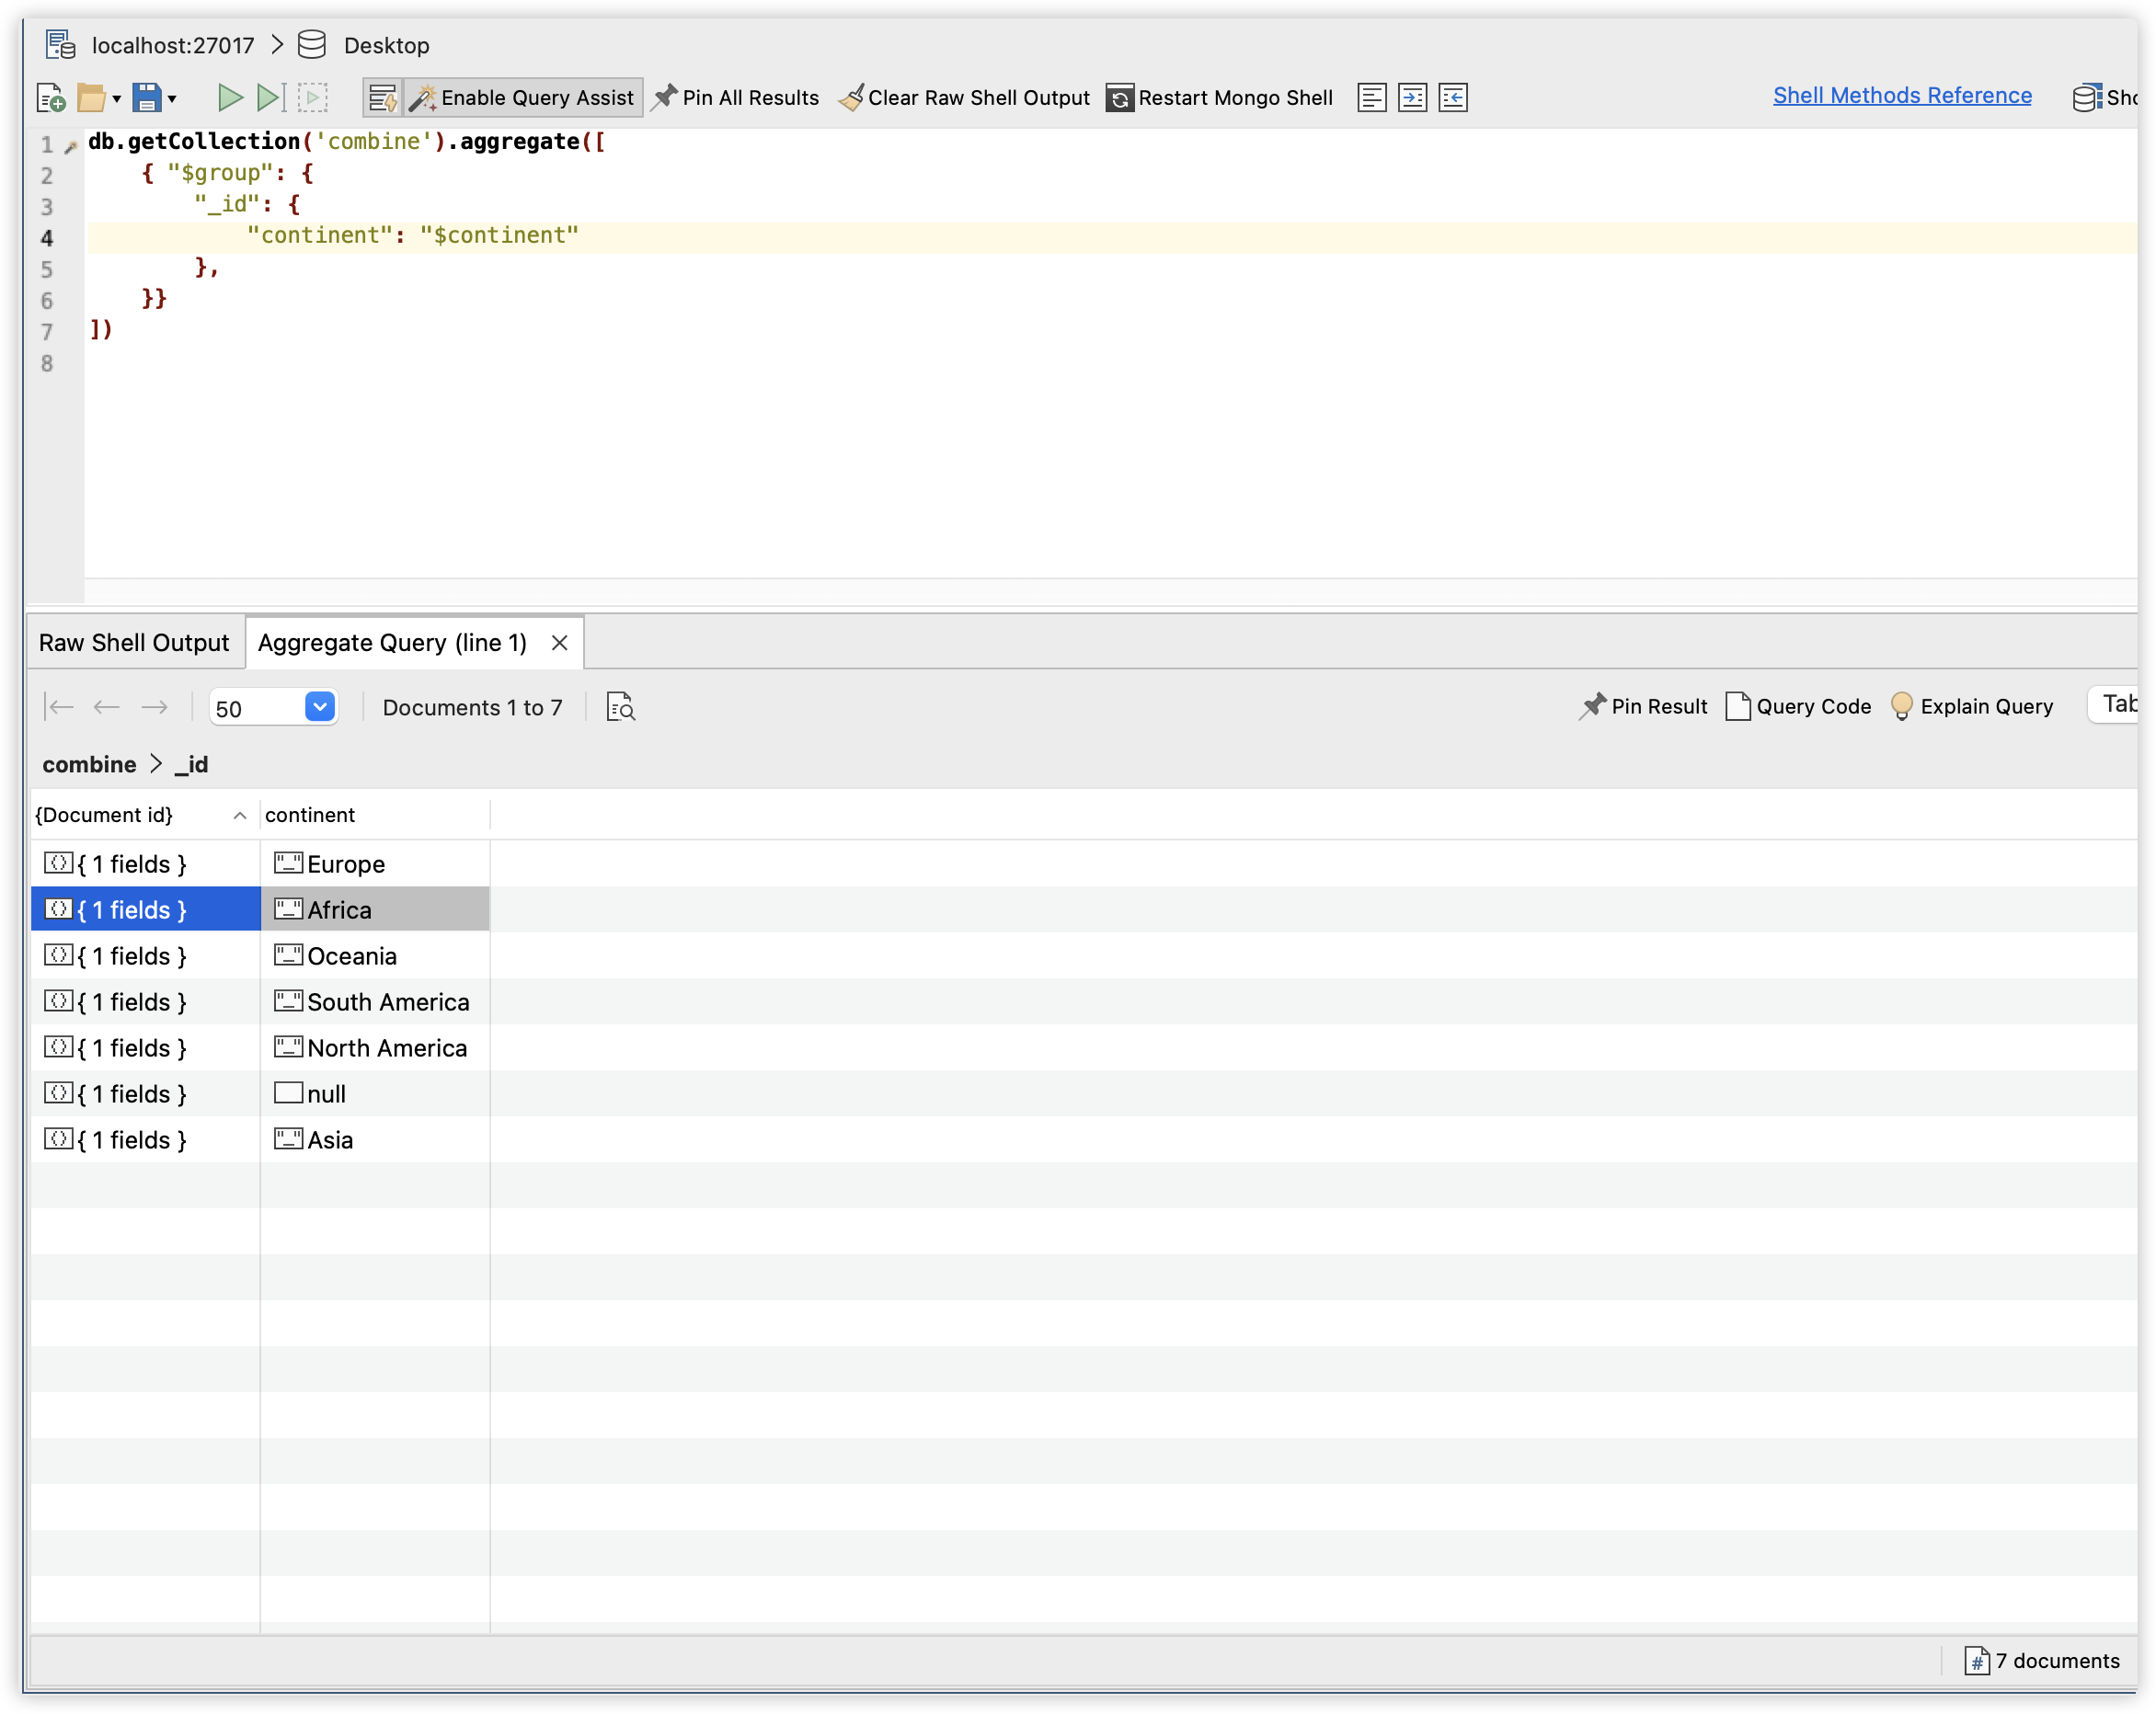
基于以上操作,我们将json文件转换成了csv,并且将原始的两个文件进行合并,在之后问题的分析中,我们可以通过导入合并后的csv到mongodb,或者使用excel打开其副本进行分析。通过mongodb我们执行
db.getCollection('combine').aggregate([
    { "$group": {
        "_id": {
            "continent": "$continent"
        },
    }}
])
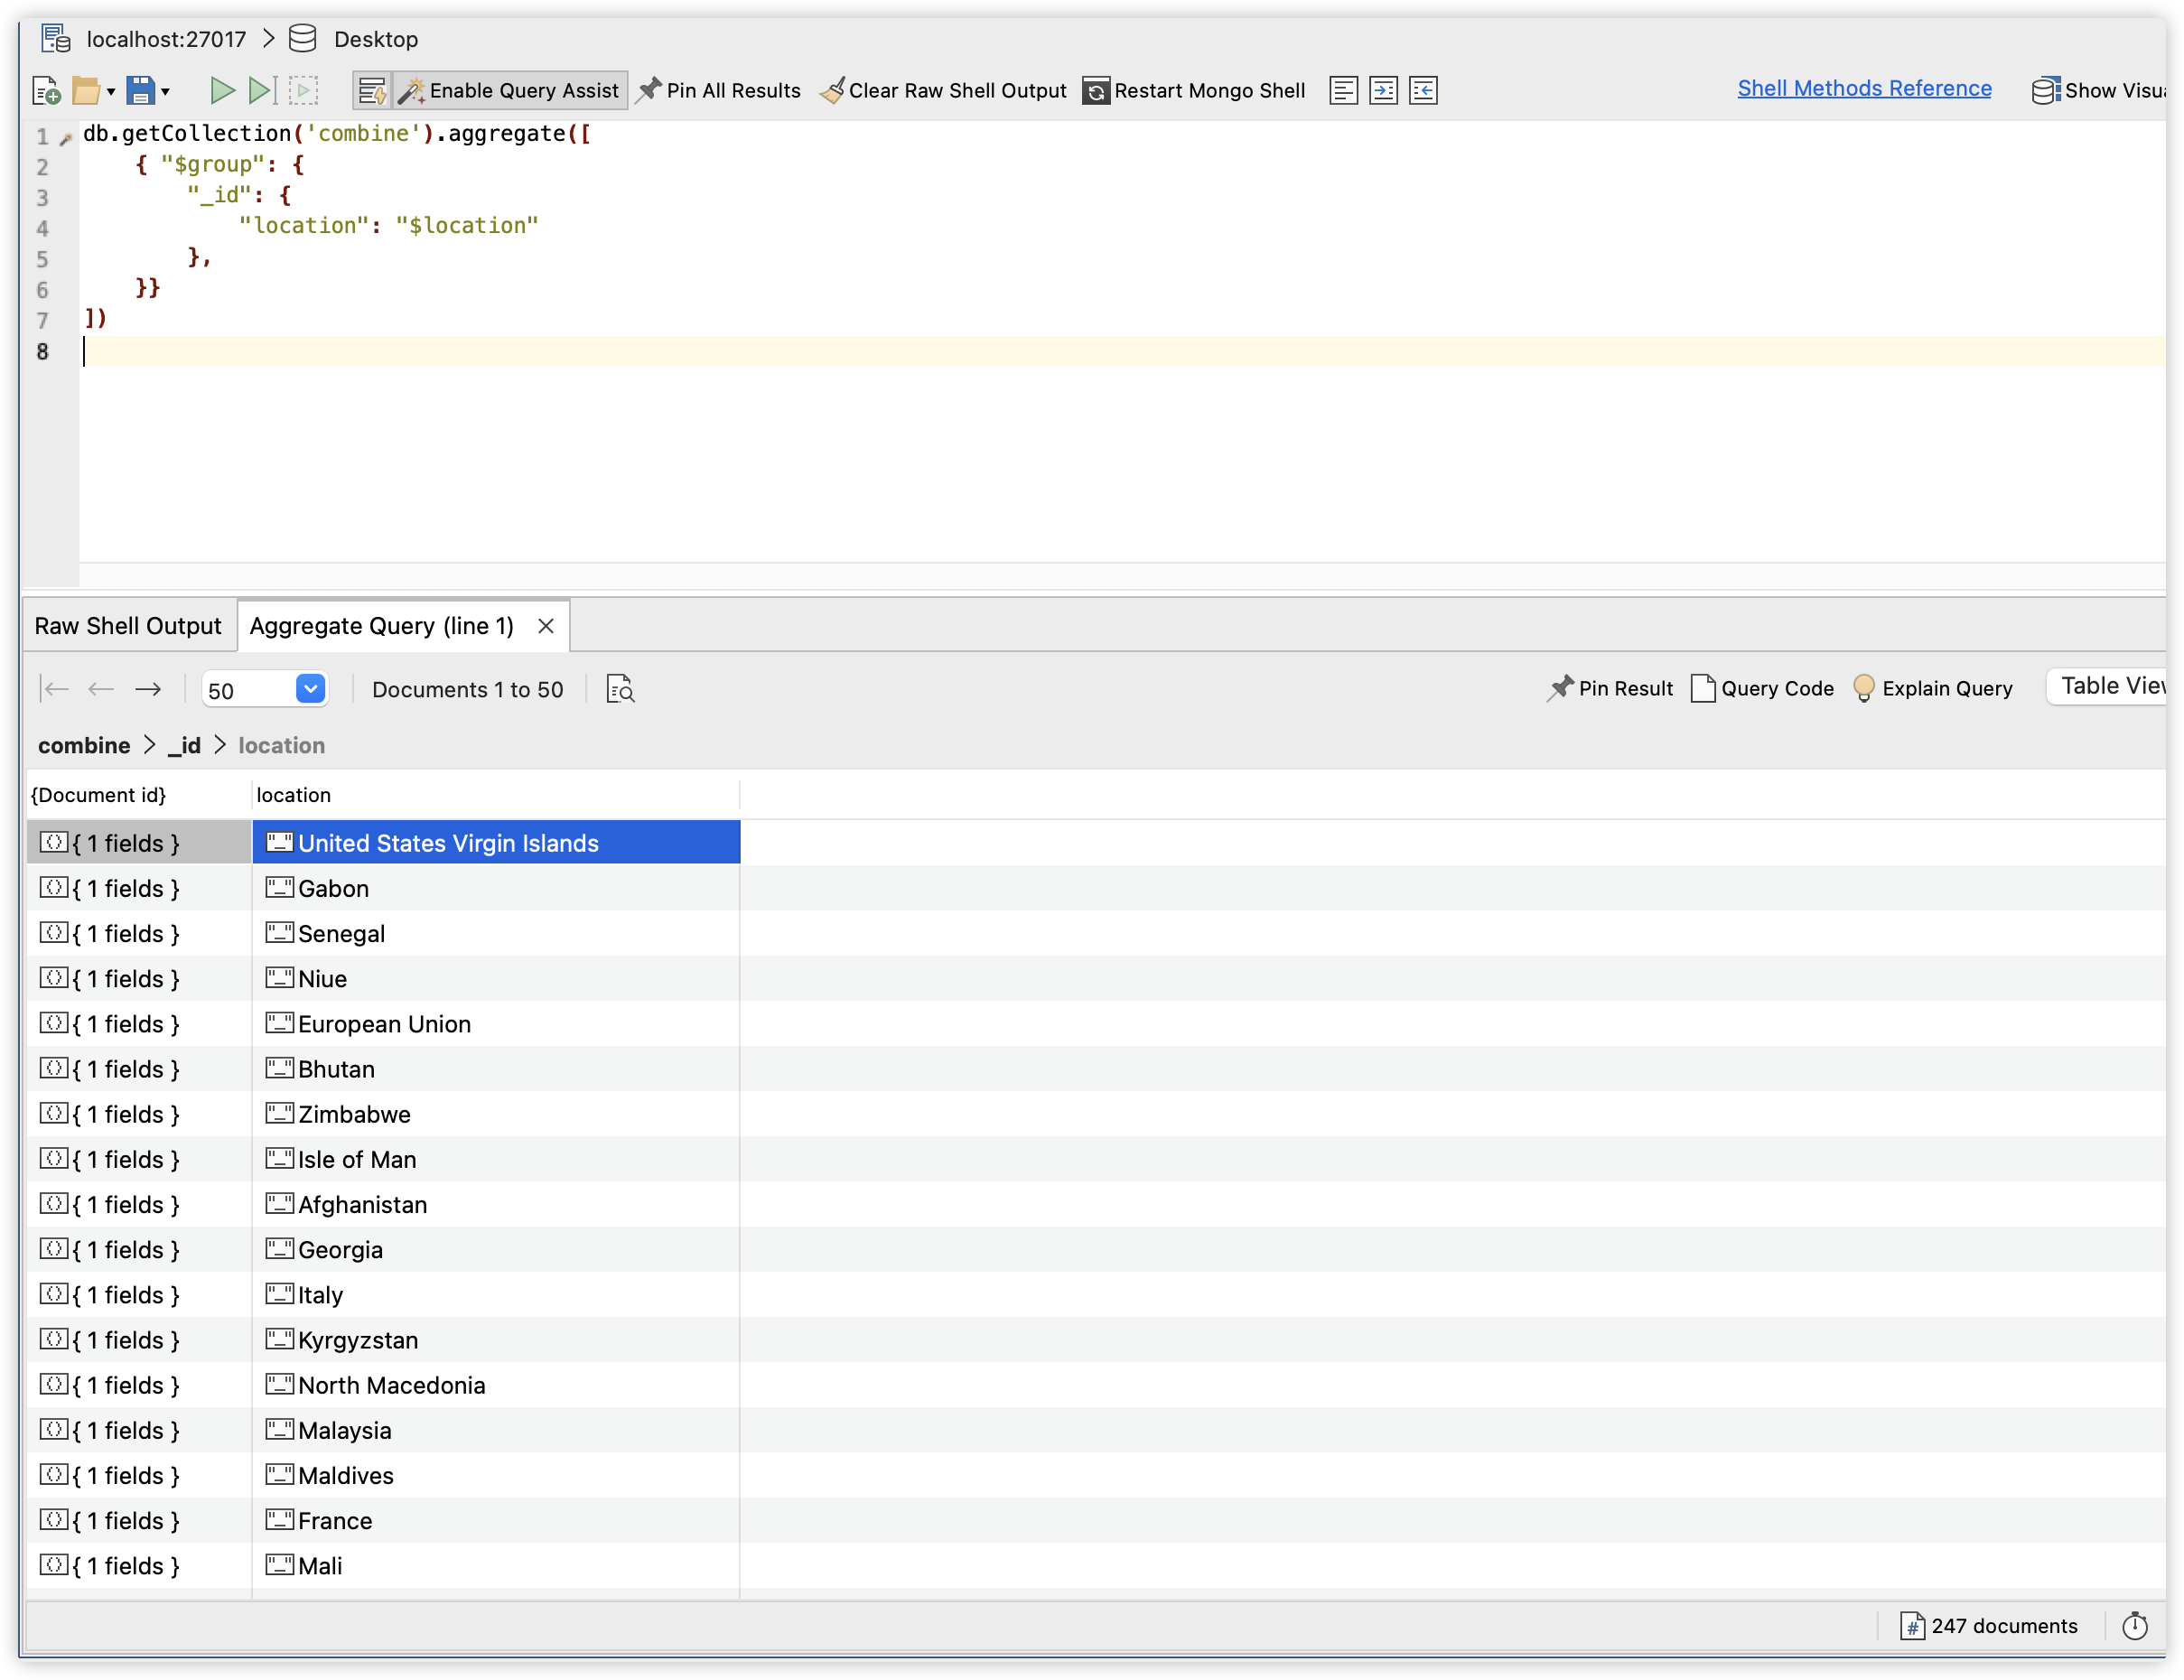
db.getCollection('combine').aggregate([
    { "$group": {
        "_id": {
            "location": "$location"
        },
    }}
])
可以知道合并后的数据涵盖了6个大洲和247个国家(这里的247个国家包括了国家集合或者某个地域的国家集合,比如low income、Europe等),针对独立的国家(地区)则拥有217个。
Questions
Question 1: 为了了解大洋洲的新冠疫情感染情况,截止到2022年4月30日,大洋洲的哪一个国家拥有最多的新冠感染病例人数,哪一个国家又有最高的感染比例?
由于原始数据是由每个国家不同日期的数据组成,因此我们需要对国家分组,再进行数据的筛选、排序。分组查询我们需要用到mongodb中的aggregate方法。对于大洋洲感染人数最多的国家的问题,使用下面的查询命令:
db.getCollection("combine").aggregate(
{
    $match:{
        continent:'Oceania',
        total_cases:{"$ne":null}
    }
},
{
    $group:{
        _id:'$location',
        total_cases:{$max:"$total_cases"},
    }
},
{
    $sort:{total_cases:-1}
}
)
我们首先用$match对数据进行过滤,获得continent为Oceania且total_cases字段不为null的documents,然后我们用$group进行分组查询,我们希望按照location字段为国家分组,然后每个组里我们用$max查询total_cases的最大值,该最大值表示了这个国家截止2022年4月30日的新冠感染病例的数量;最后,我们使用$sort对total_cases进行降序排序,则第一个数据就是感染病例最多的国家。

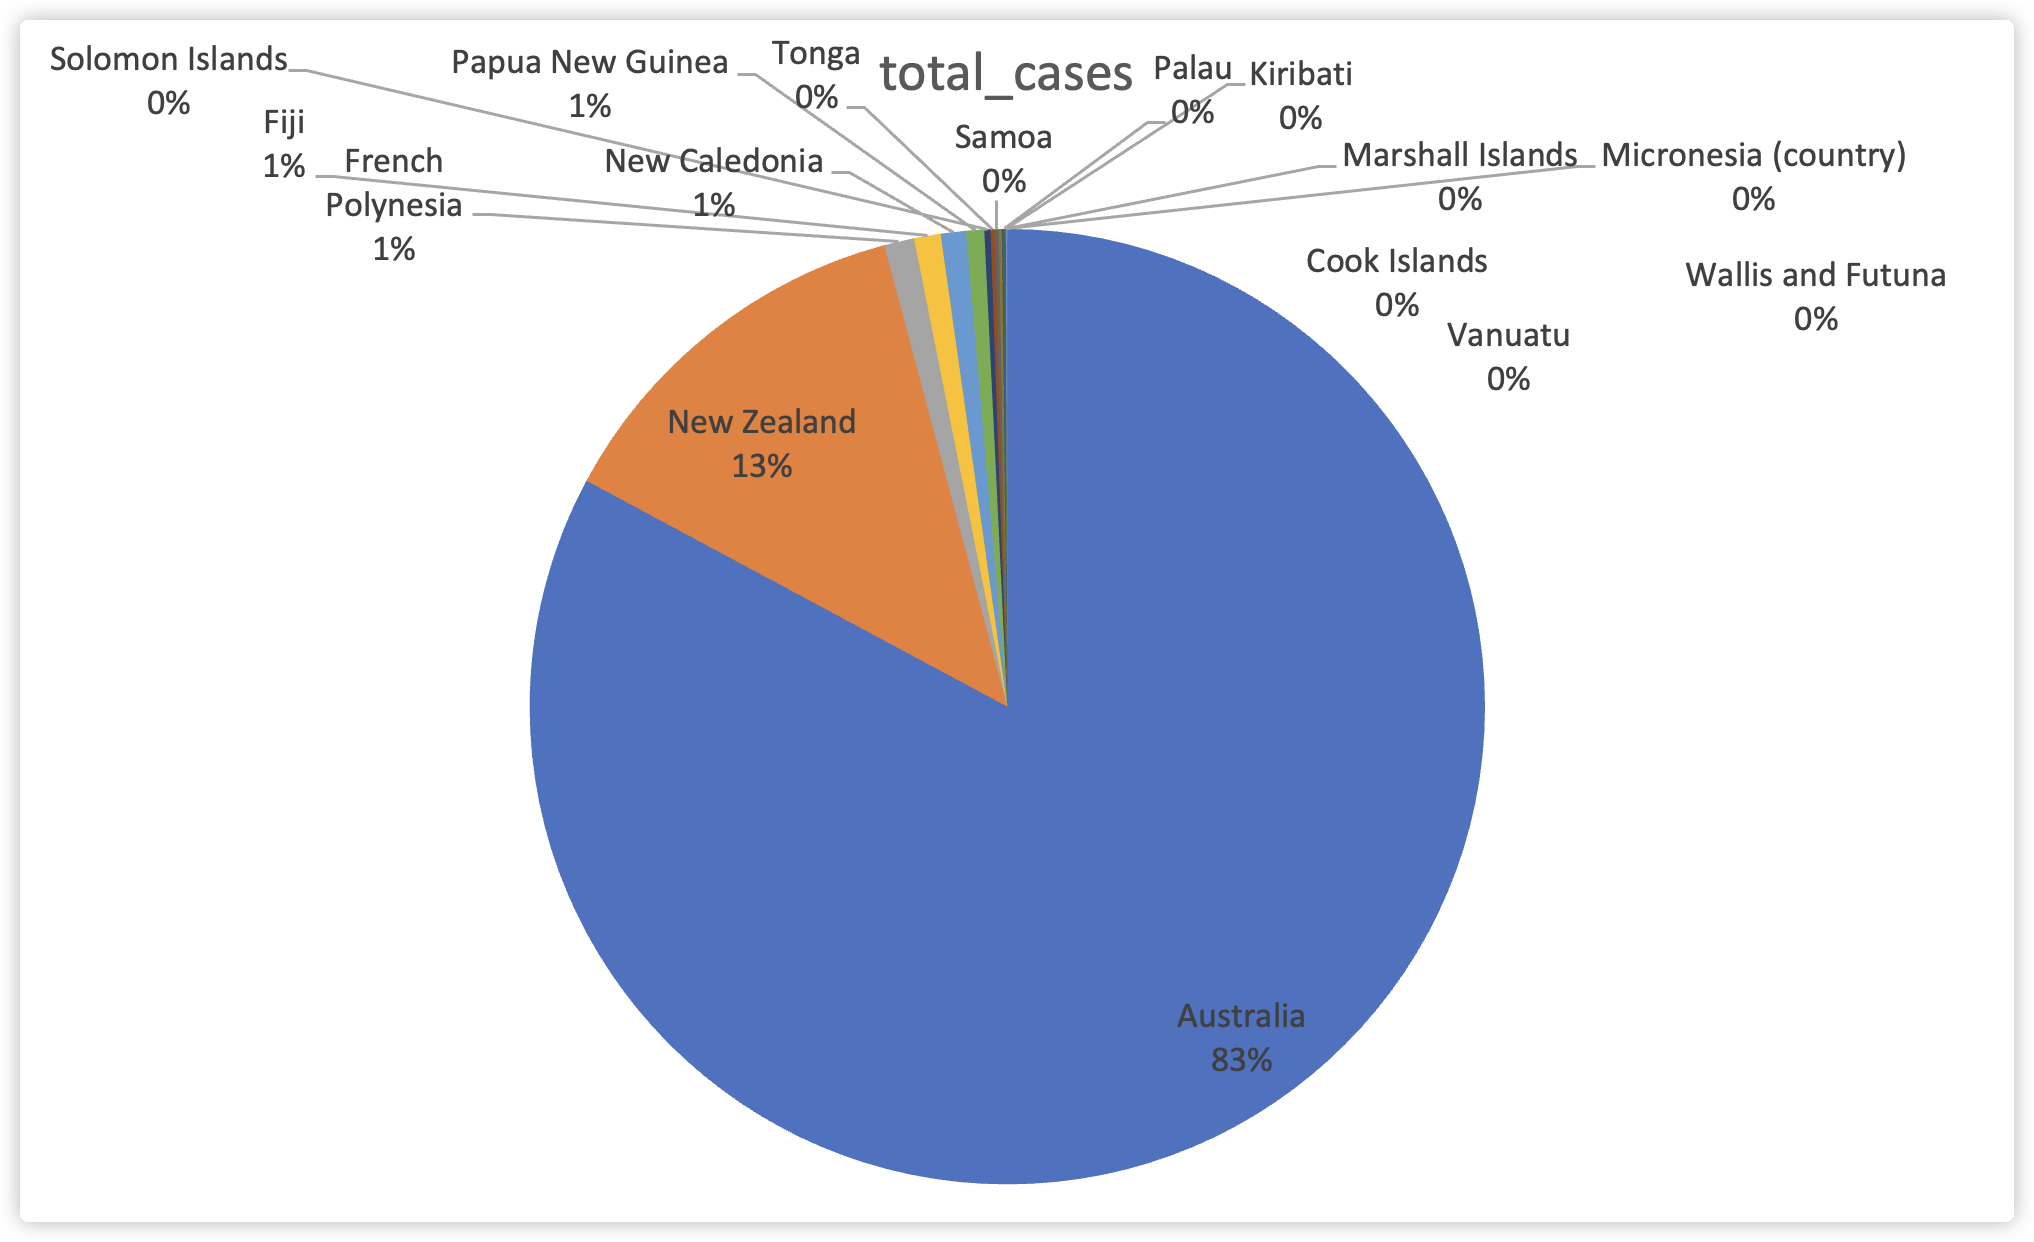
查询结果显示,Australia拥有最高的新冠病例感染数量,高达5927528例;而New Zealand拥有第二的930969的感染病例数。在Excel中通过图表形势可以更清晰展现不同国家的病例感染情况。
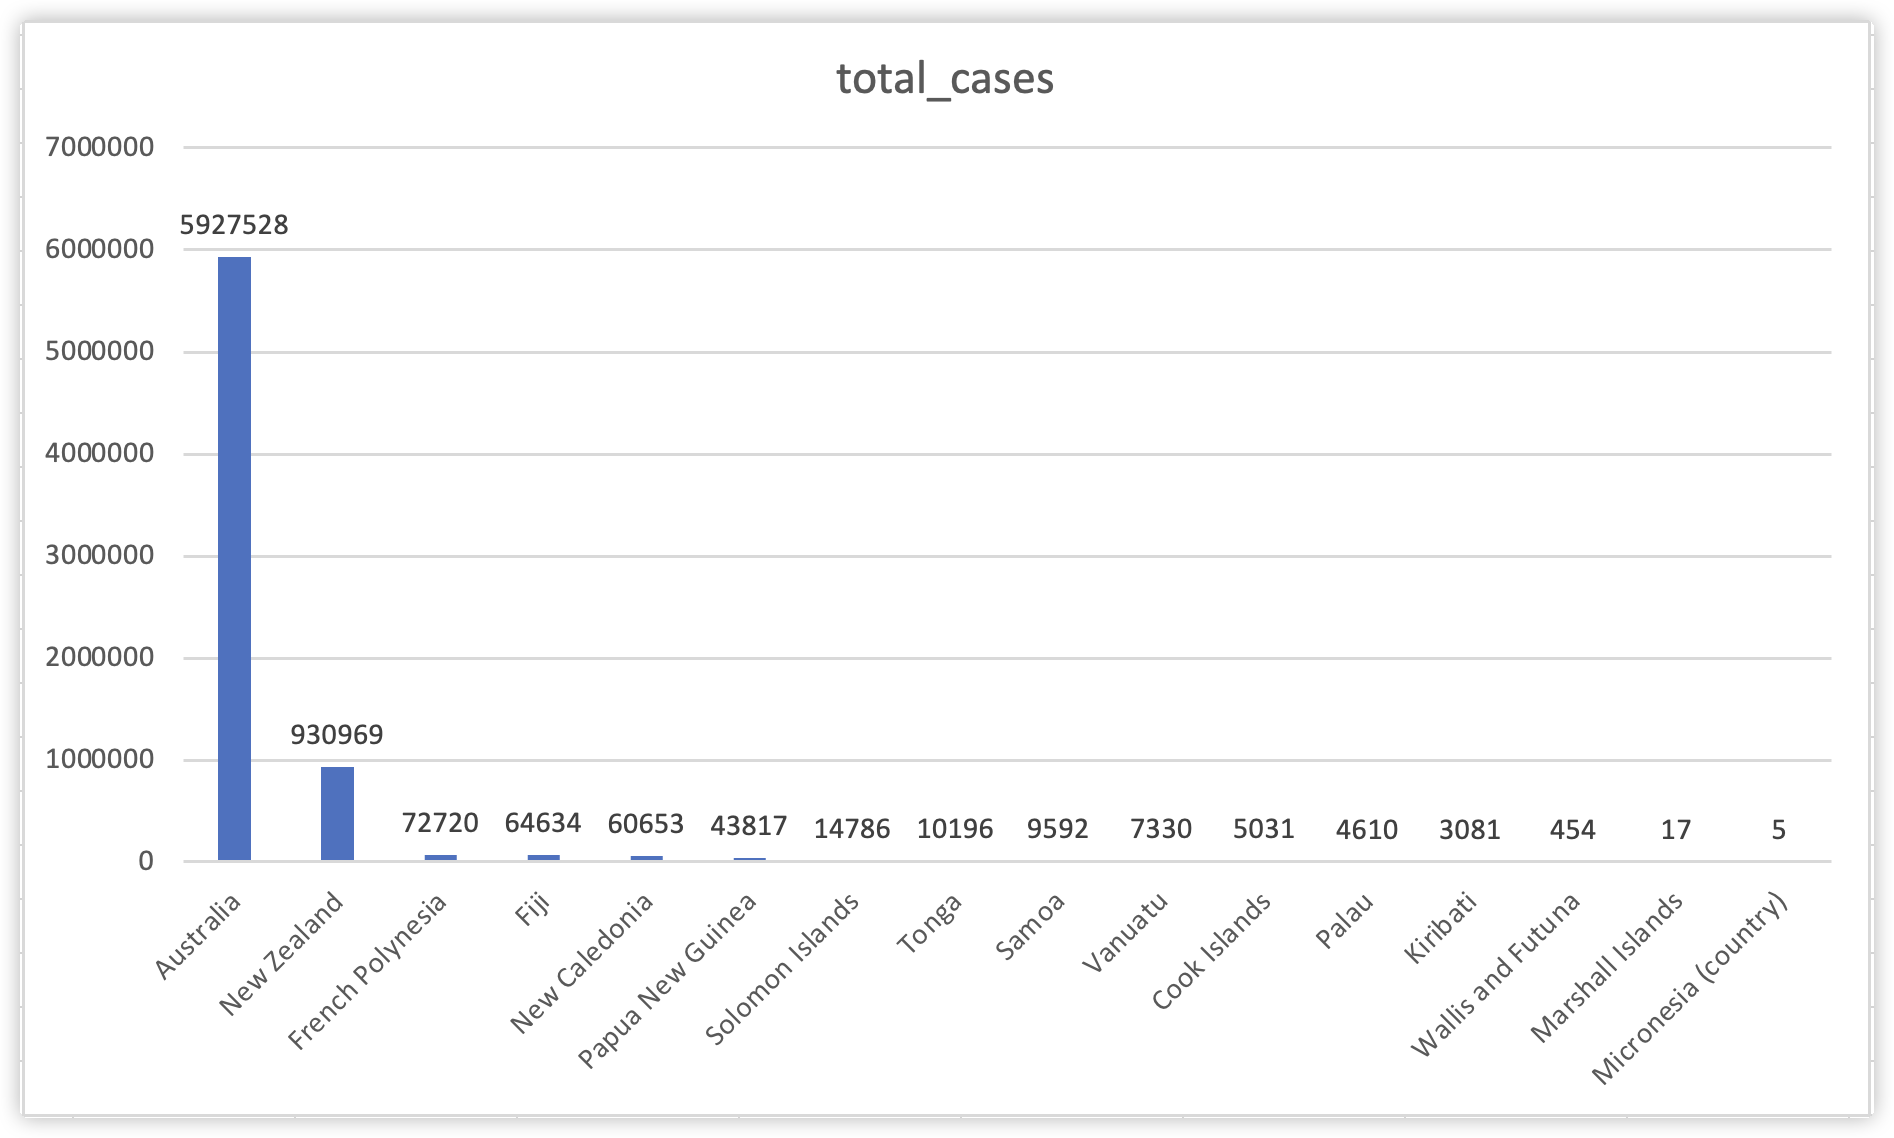
我们可以知道Australia感染人数远远超过其他国家,与此同时New Zealand也拥有超过其他国家的感染人数。这两个国家的感染人数分别占据了整个大洋洲的83%和13%,其他国家占据甚至连1%都不到。
由于Australia和New Zealand拥有整个大洲的最高居住人口,其感染人数极高是符合实际情况的。所以我们也要关注感染人数占总人口的比例。因此,我们针对第二个问题哪个国家感染比例最高,我们同样地使用mongodb查询,与之前的不同在于分组后取最大值的字段变为了‘total_cases_per_million’,表示每million人中的感染病例数,最后的执行命令为:
db.getCollection("combine").aggregate(
{
    $match:{
        continent:'Oceania',
        total_cases_per_million:{"$ne":null}
    }
},
{
    $group:{
        _id:'$location',
        total_cases_per_million:{$max:"$total_cases_per_million"},
    }
},
{
    $sort:{total_cases_per_million:-1}
}
)
我们同样需要排序,以感染比例降序方式排列,最后的结果输出为:
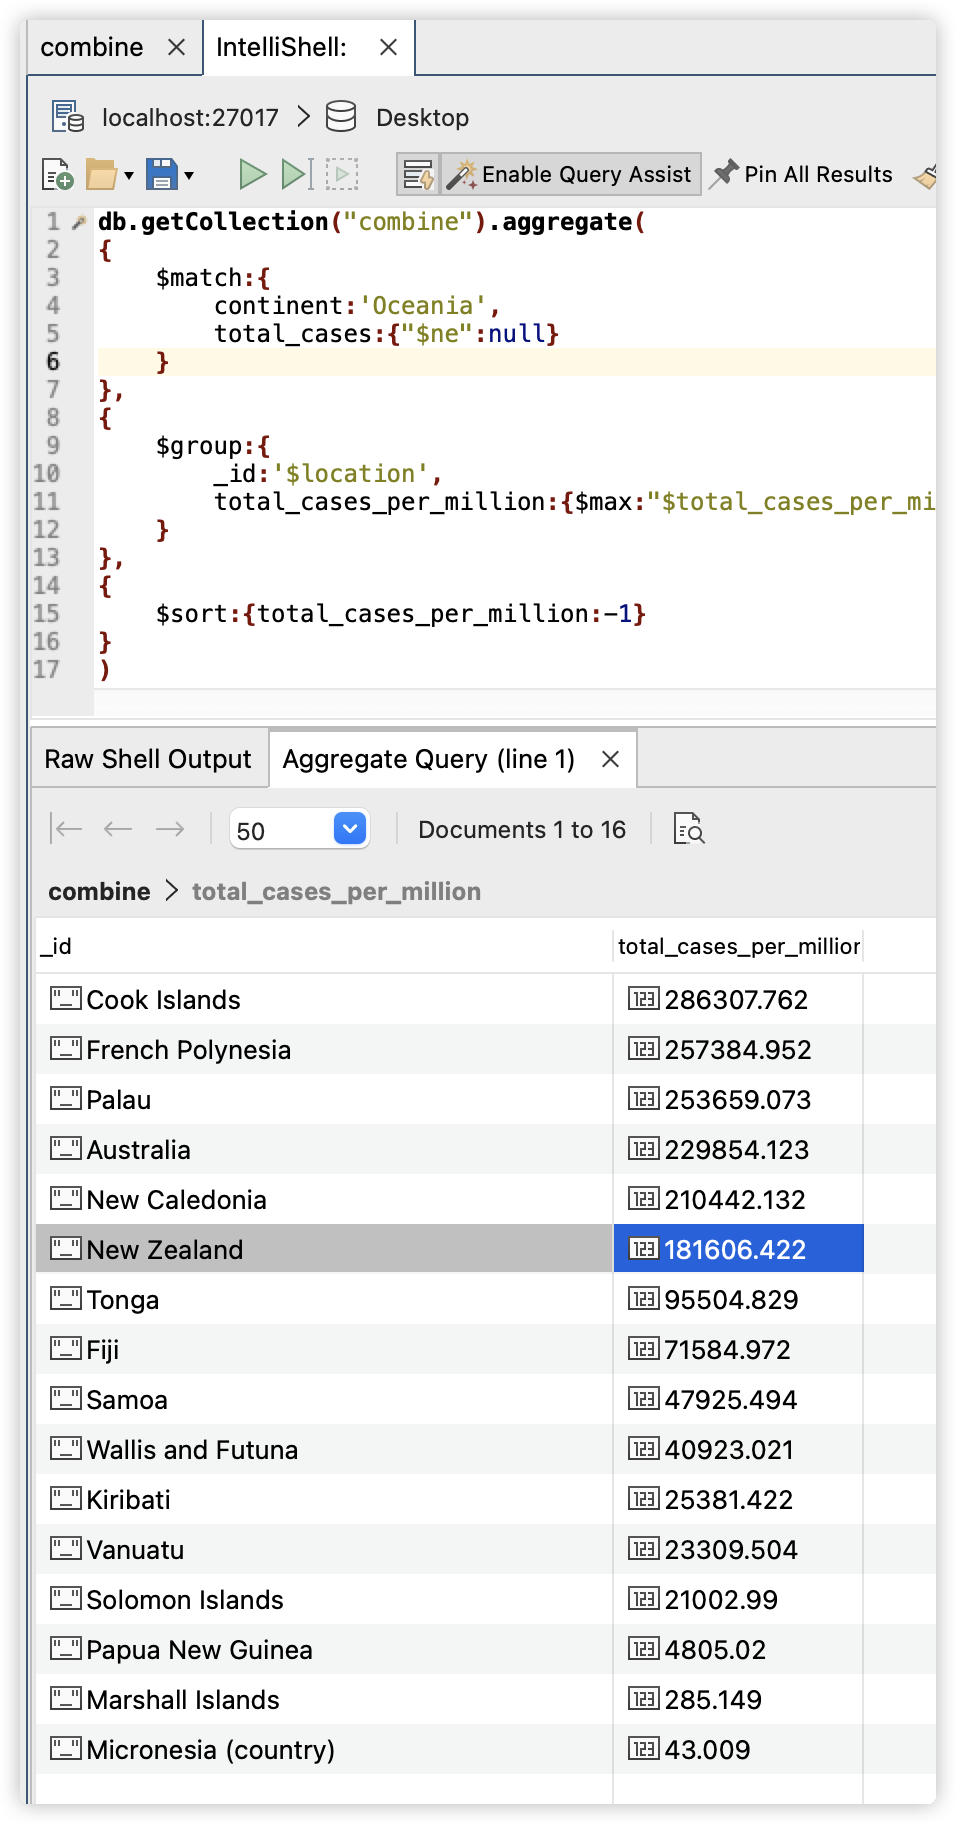
因此我们得到结论:Cook Islands以每百万人感染286307.762人在大洋洲所有国家中新冠感染比例排行第一,而French Polynesia感染比例第二;上一个问题我们讨论的感染人数极端超越其他国家的Australia和New Zealand的感染比例却分别只排行第4和第6。我们在excel中能够看到不同国家感染比例的差距。
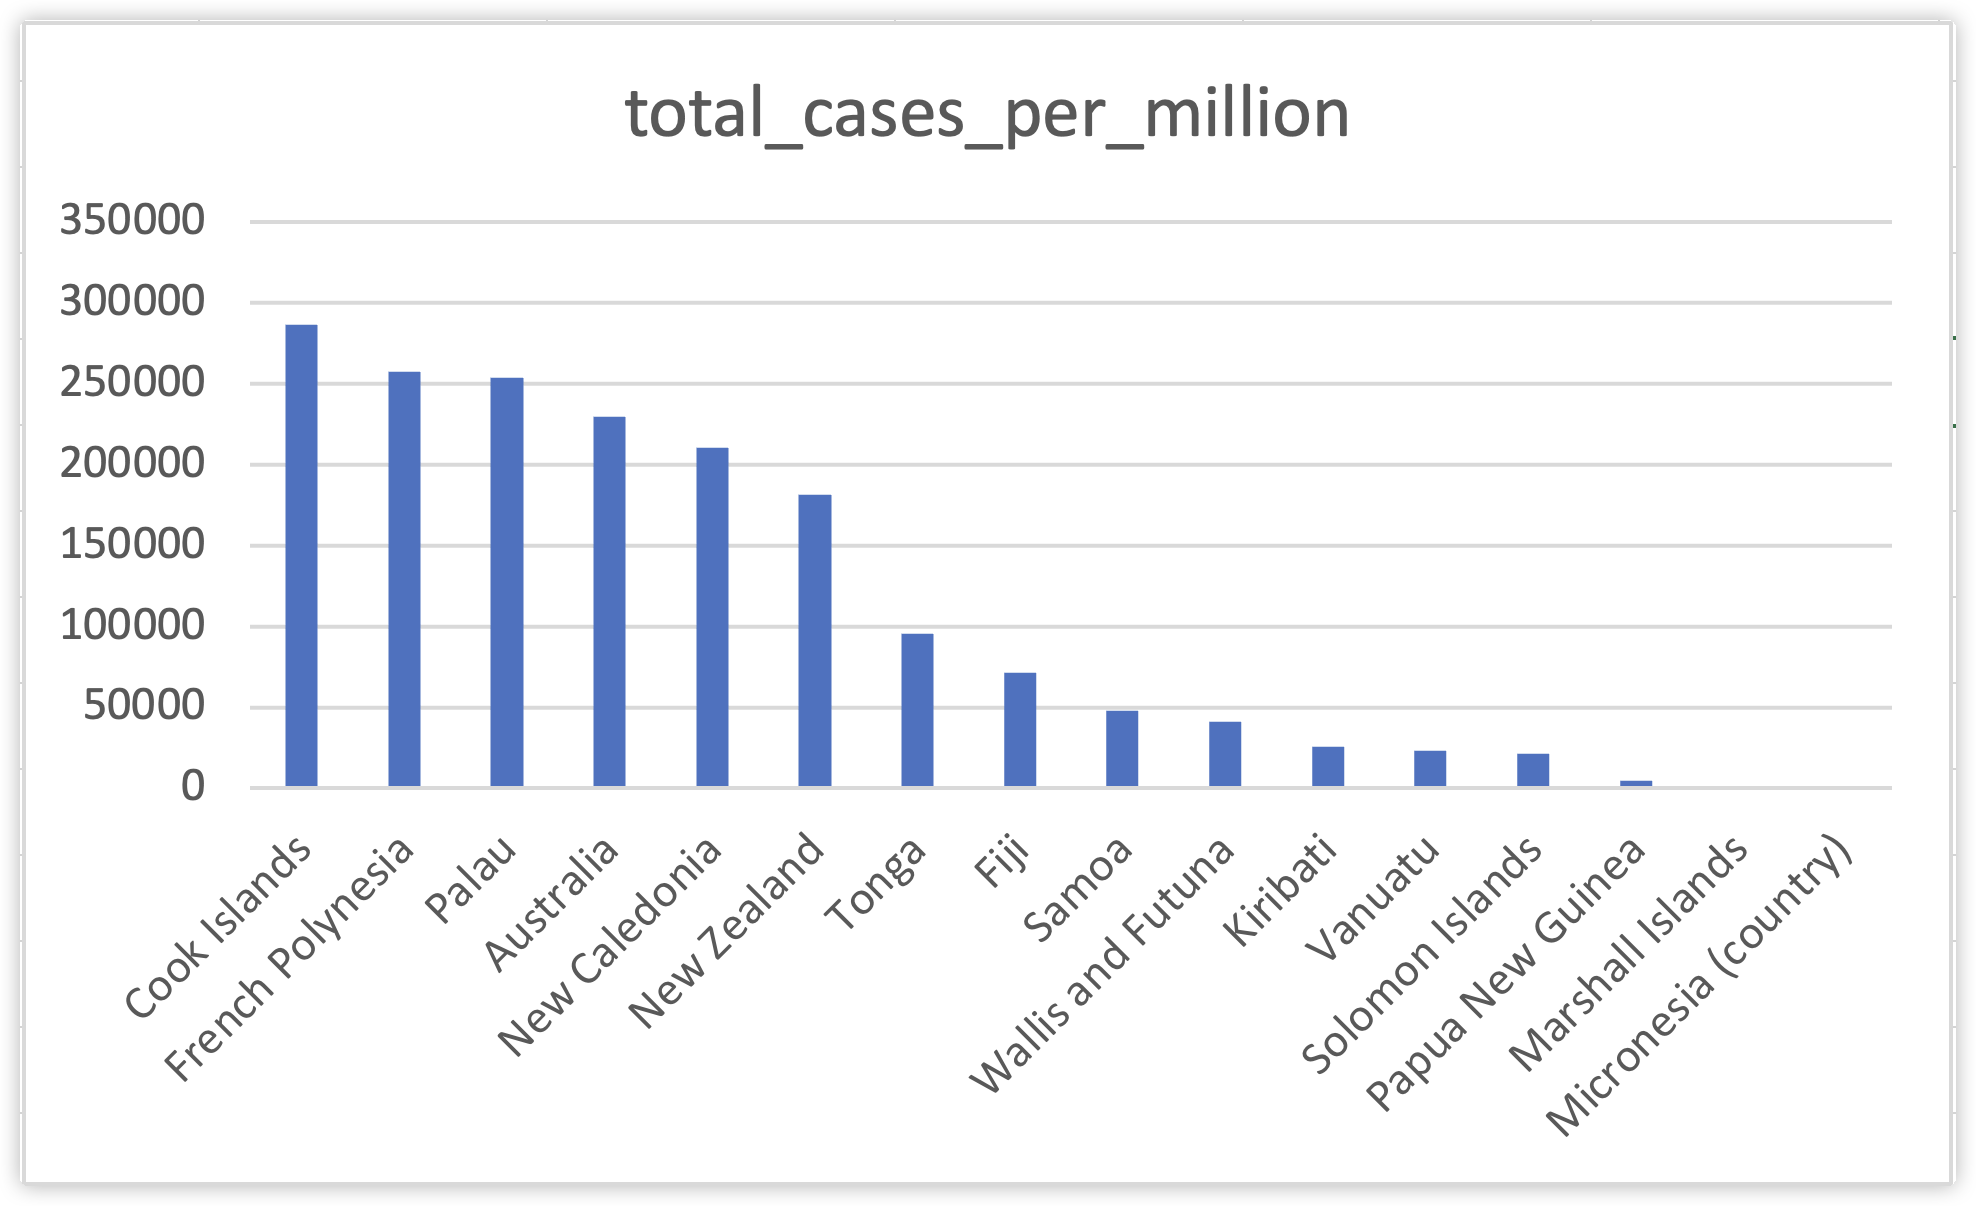
数据图表明即使感染人数有极端的差距,但是从感染的比例而言,不同国家的差距并不会出现如此极端的现象。
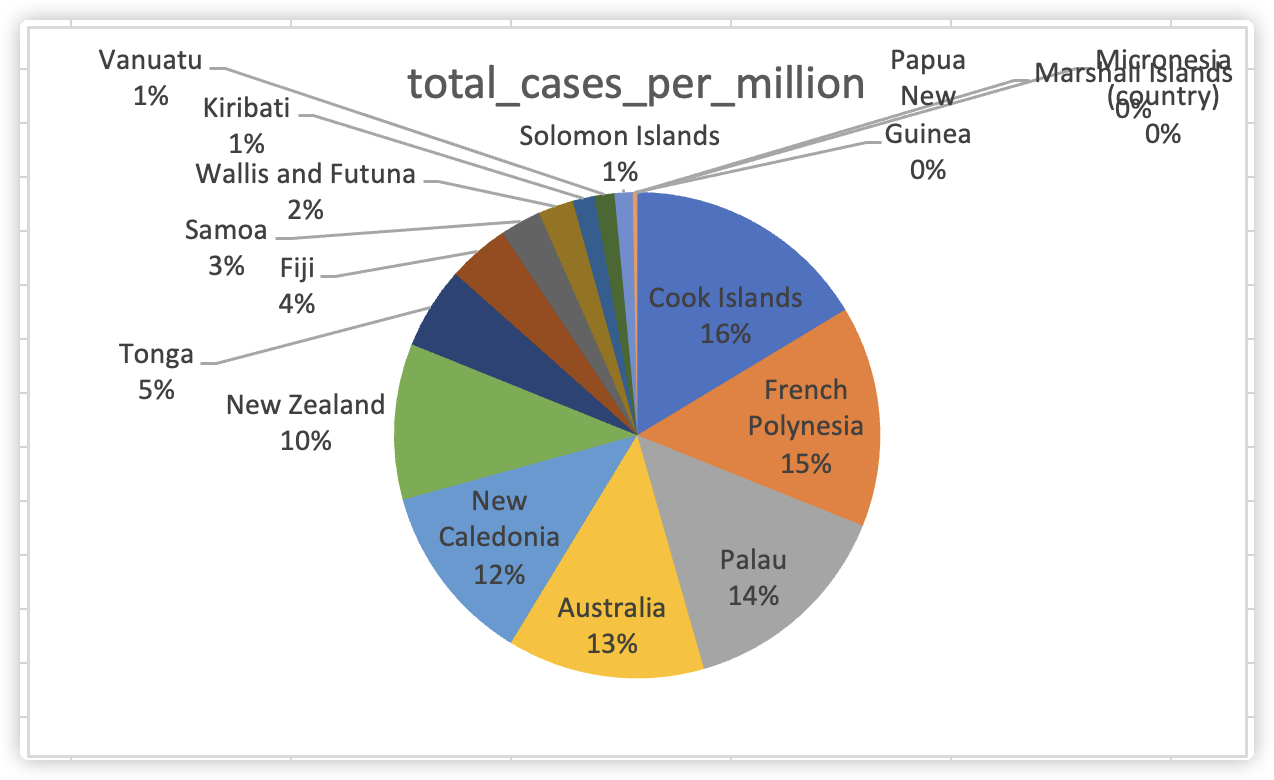
透过饼图我们可以看出感染比例最高的几个国家Cook Islands、French Polynesia、Palau、Australia、New Caledonia、New Zealand差异并不大,以100%为标准,他们的感染比例几乎相似,阶梯差距都在1%左右。
总而言之,对大洋洲而言,Australia拥有最多人数的新冠感染病例;而Cook Islands拥有最高的新冠感染比例。
Question 2: 自新冠疫情在中国爆发以来,中国在疫苗研发和接种上一直处于世界领先地位,中国在数据集中的217个国家接种率排行多少?从2021年1月开始至2022年5月,中国哪一天的接种次数最高,达到了多少人次?
针对这个问题,我们需要首先为所有国家分组,找出每个国家的total_vaccinations_per_hundred字段中的最大值,然后排序进行比较,判断中国是否是所有国家中疫苗接种率最高的国家。
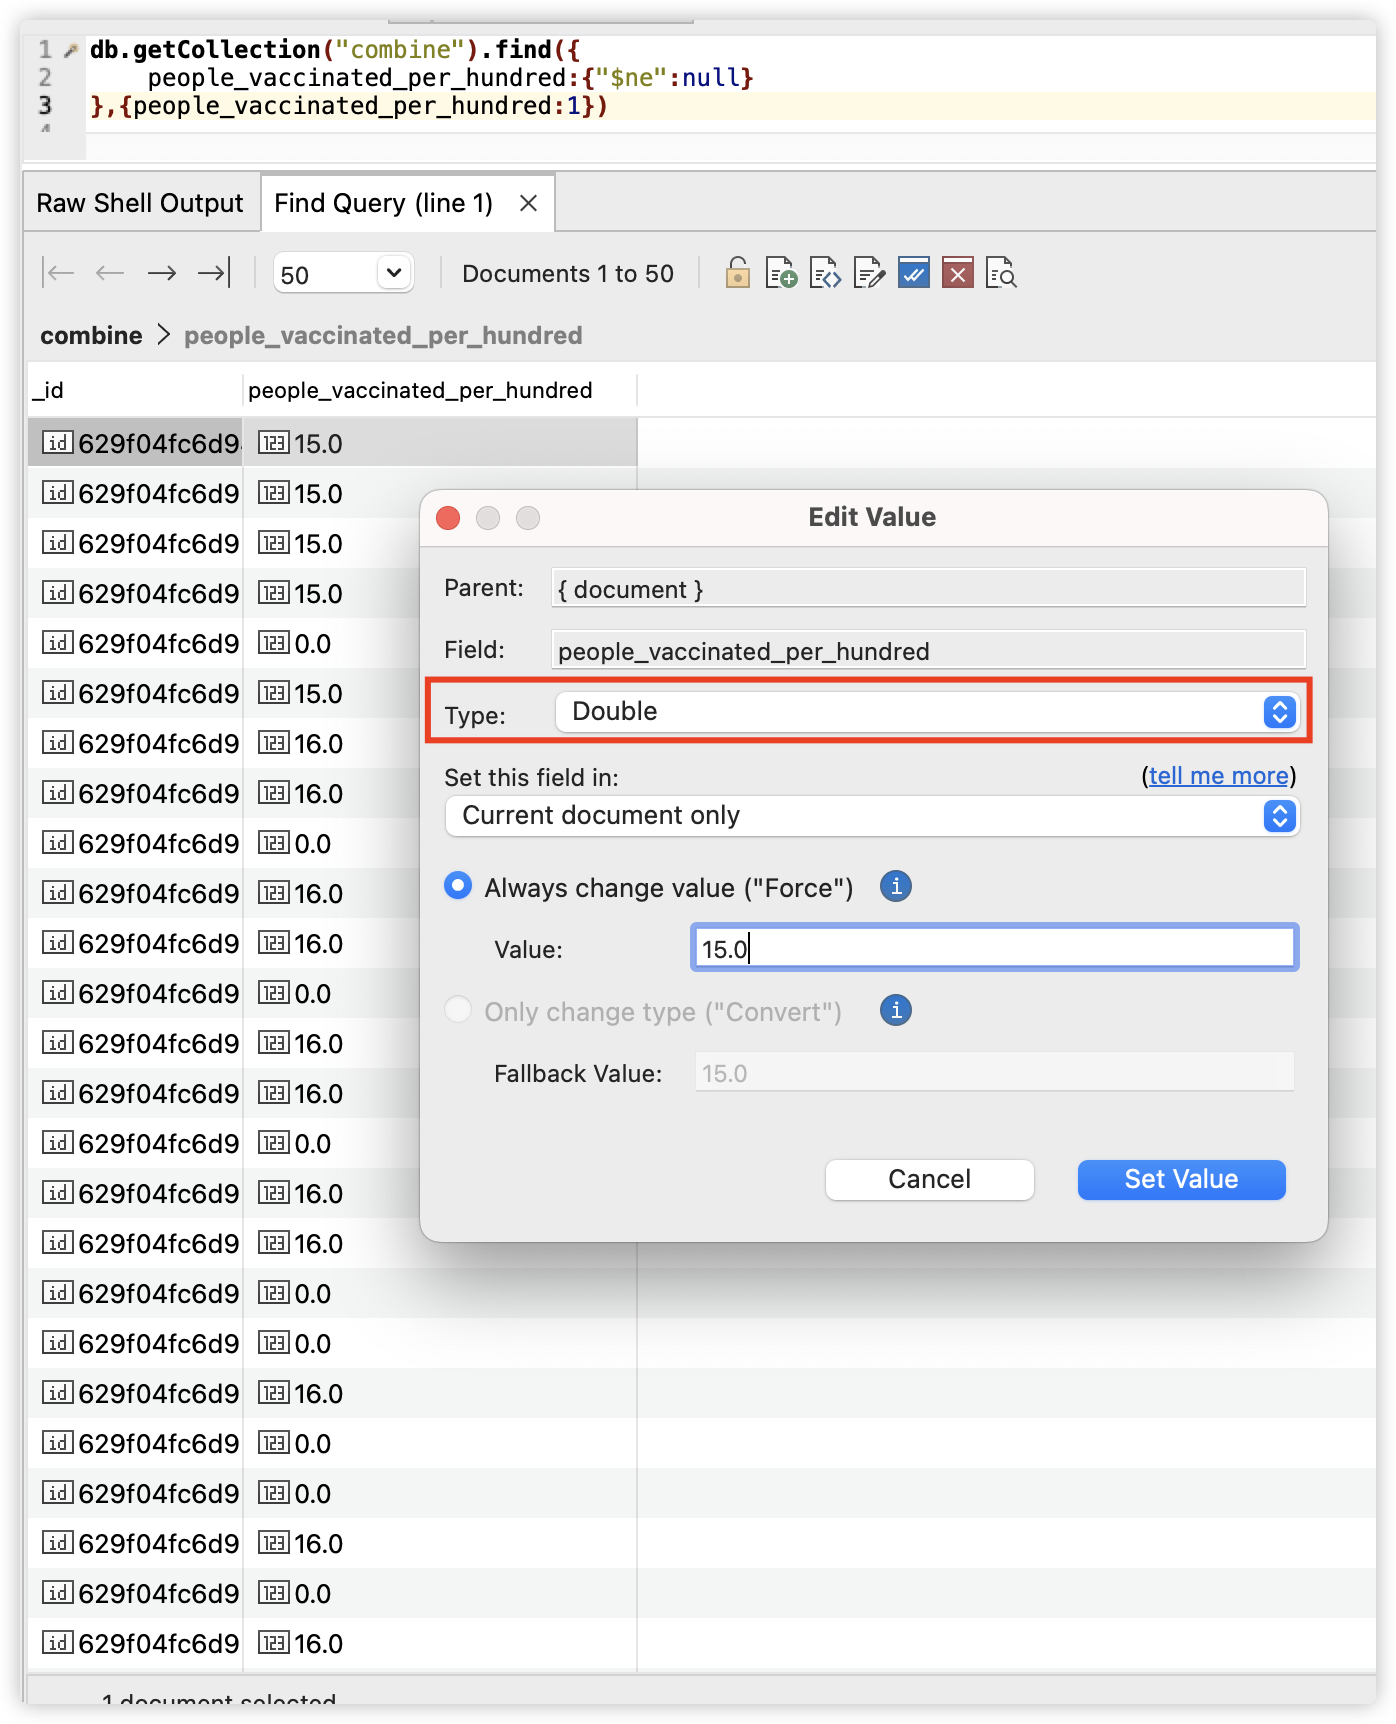
在排序之前,我们观察到people_vaccinated_per_hundred字段是string类型,
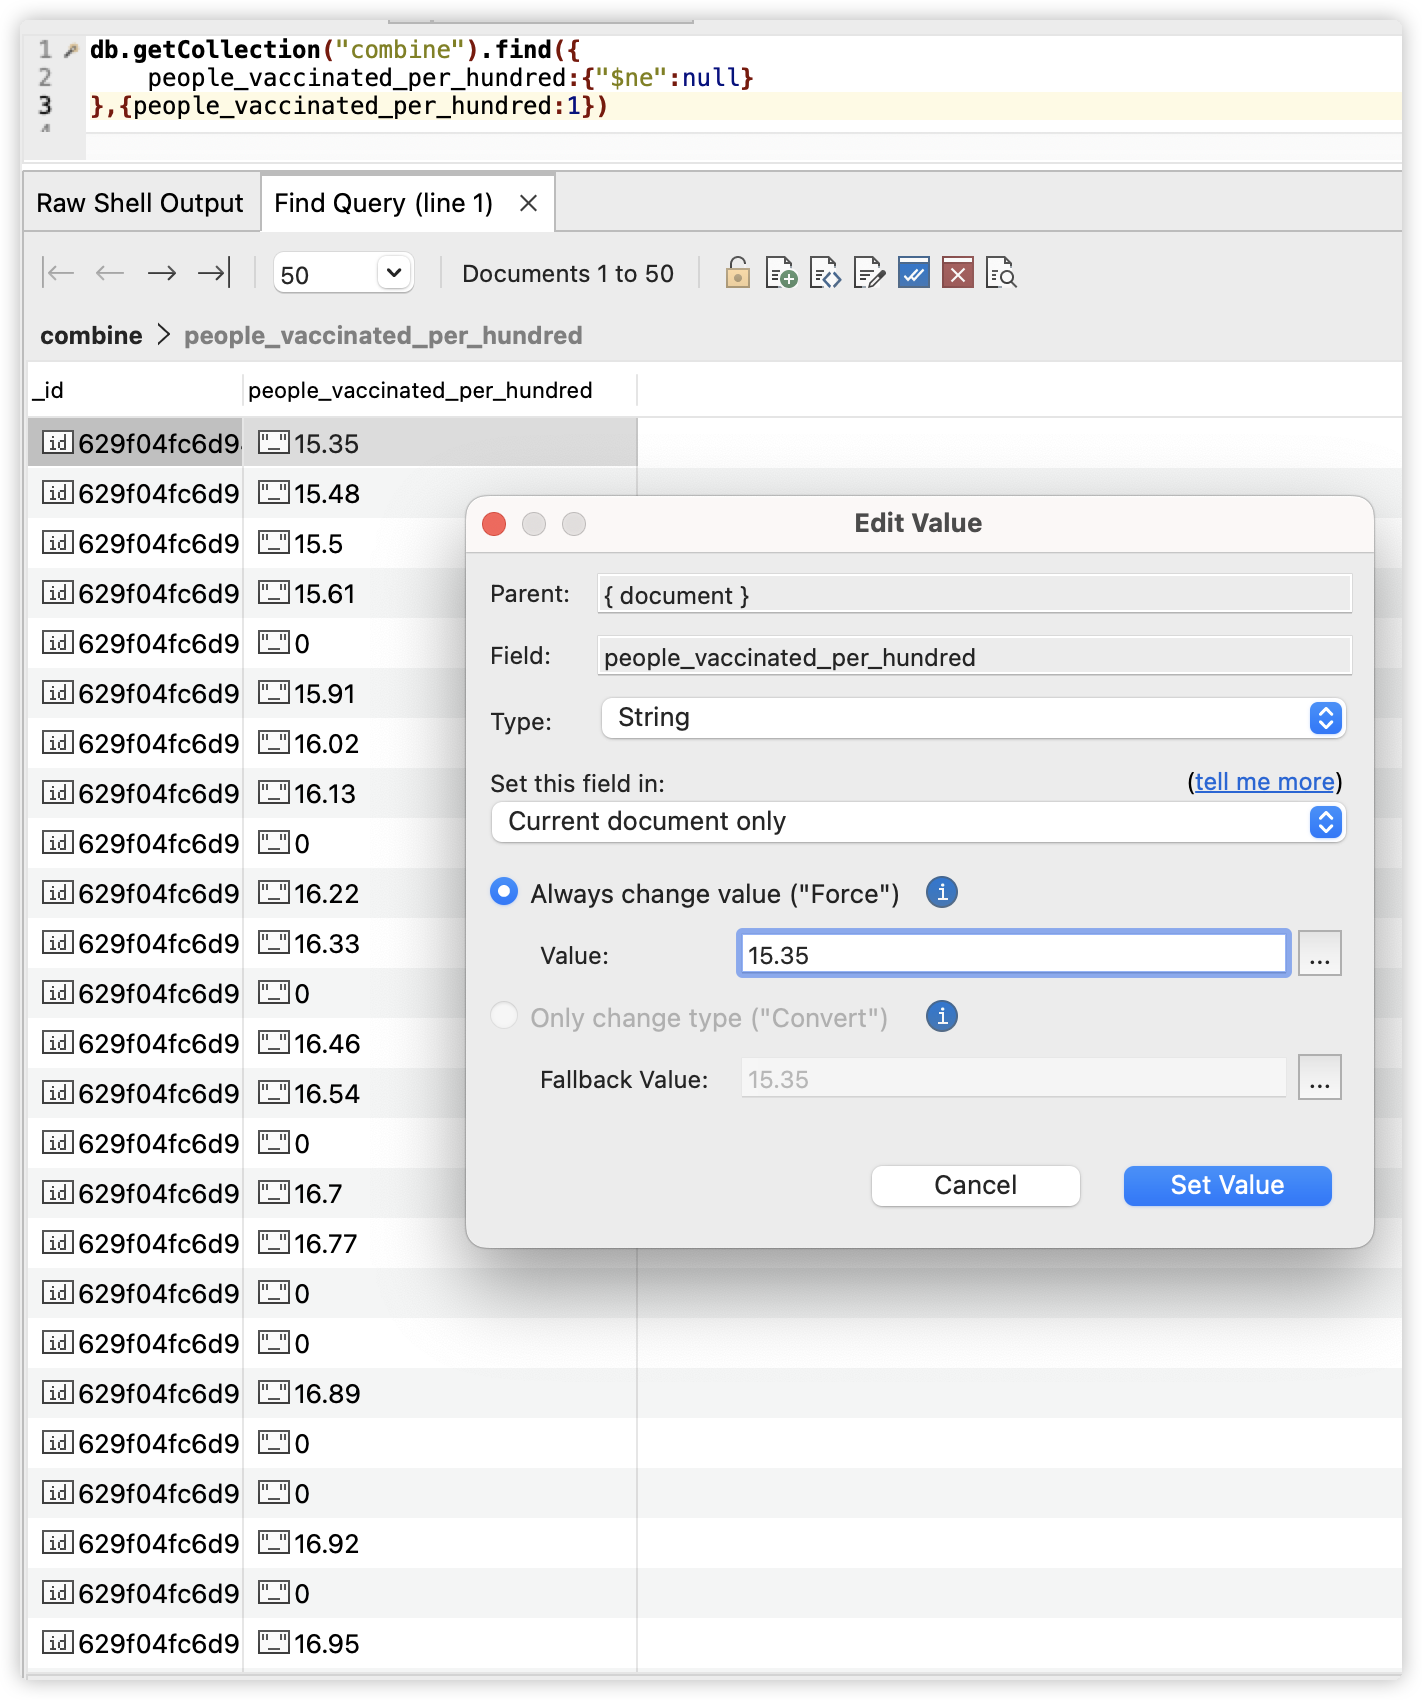
因此我们需要将该字段的所有数据转换成double型,我们使用的mongodb命令如下:
db.combine.find().forEach( function (x) {
    if(x.people_vaccinated_per_hundred!=null){
        x.people_vaccinated_per_hundred = parseInt(x.people_vaccinated_per_hundred);
        db.combine.save(x);
    }
});
命令找到了集合中people_vaccinated_per_hundred字段不为空的地方,然后让它转换成double类型并保存在了集合中。执行该操作后的这个字段类型可以看到已经变为了double型。
然后我们执行如下命令:
db.getCollection("combine").aggregate(
{
    $match:{
        continent:{$in:['Oceania','Asia','Africa','Sounth America','North America','Europe']},
    }
},
{
    $group:{
        _id:'$location',
        people_vaccinated_per_hundred:{$max:"$people_vaccinated_per_hundred"}

    }
},
{
    $sort:{people_vaccinated_per_hundred:-1}
}
)
该命令查找了所有独立国家(地区)中people_vaccinated_per_hundred的最大值,并按照这个值降序排序,查询结果为:
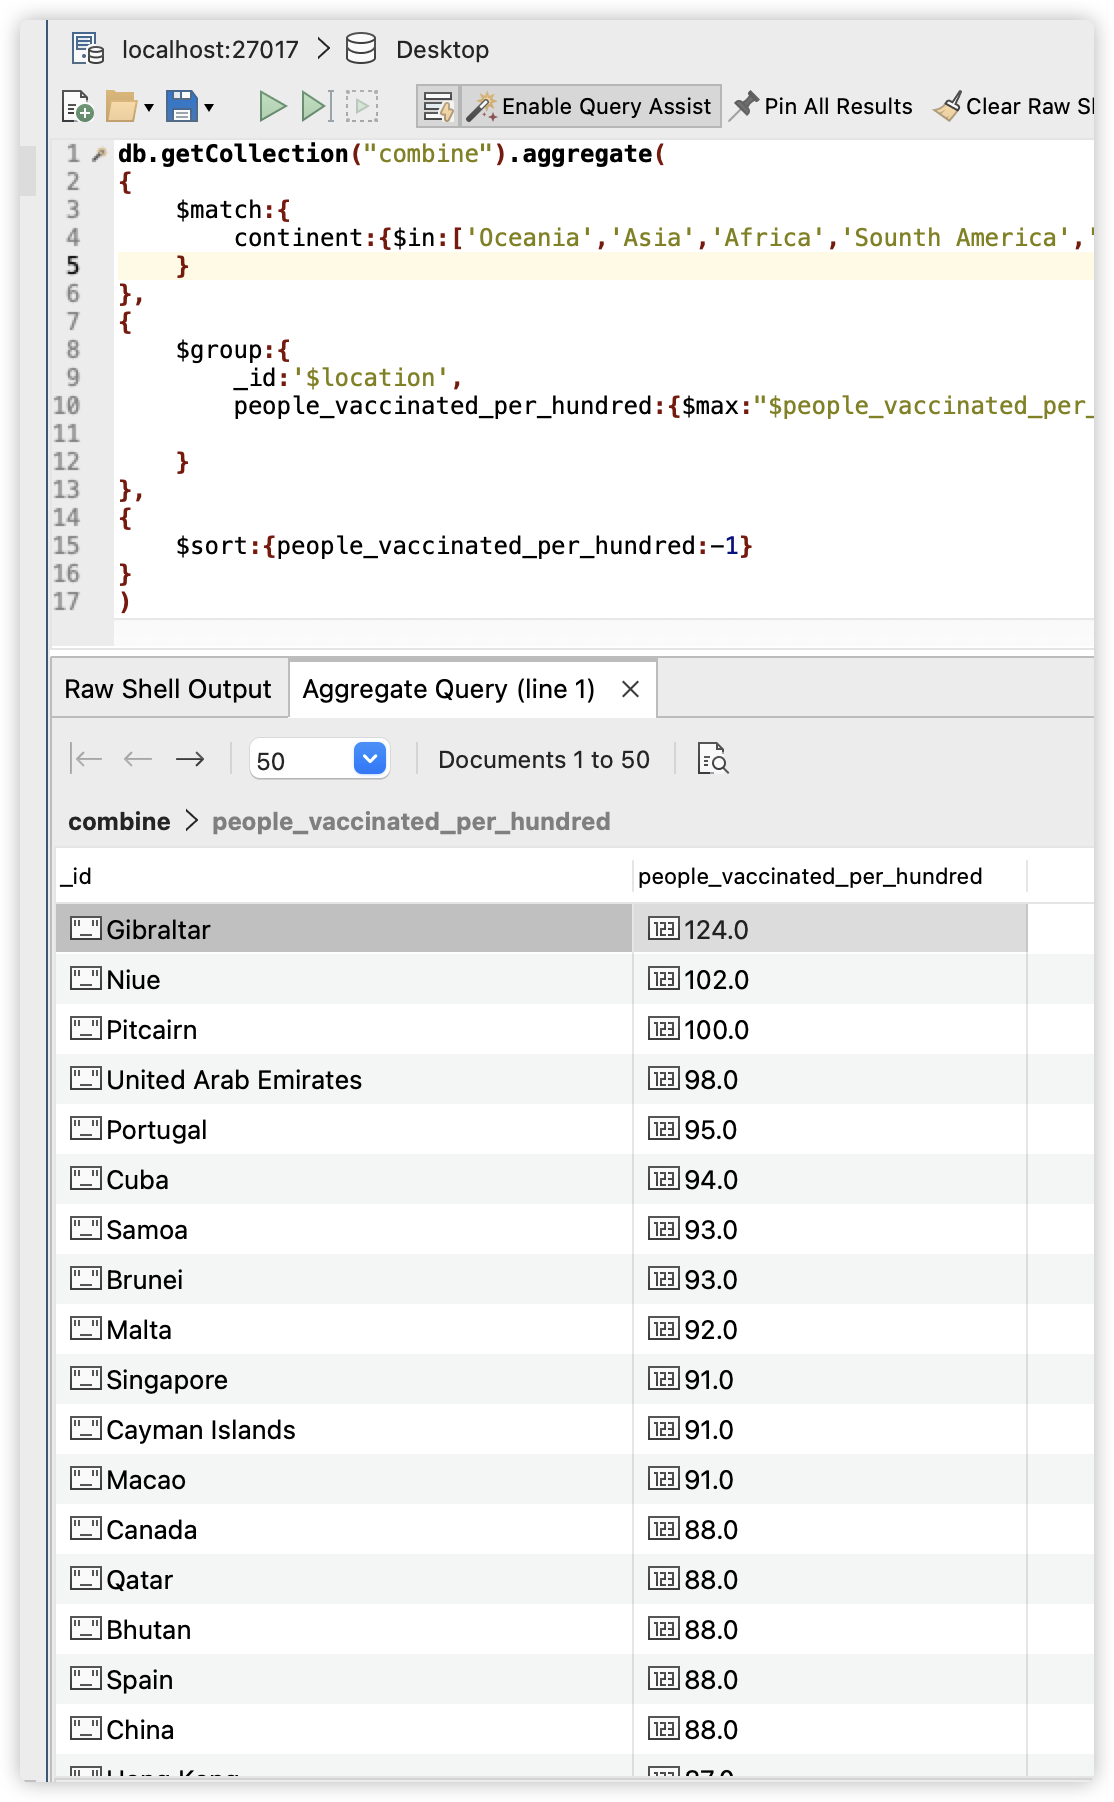
我们可以看到中国的people_vaccinated_per_hundred为88,并列排行13,其中排行第一的国家是Gibraltar。但是值得注意的是中国拥有世界第一多的人口1.4billion,这样的数据已经相当的惊人;而排行第一的国家仅有33,691的人口,排行第二的Niue仅拥有1,620人口,排行第三的仅有67人口**。**
针对第二个问题,中国哪一天接种人数最高,我们当然也可以使用mongodb进行查询,但是为了充分利用各种工具,我们使用excel中的数据透视表来完成该操作。
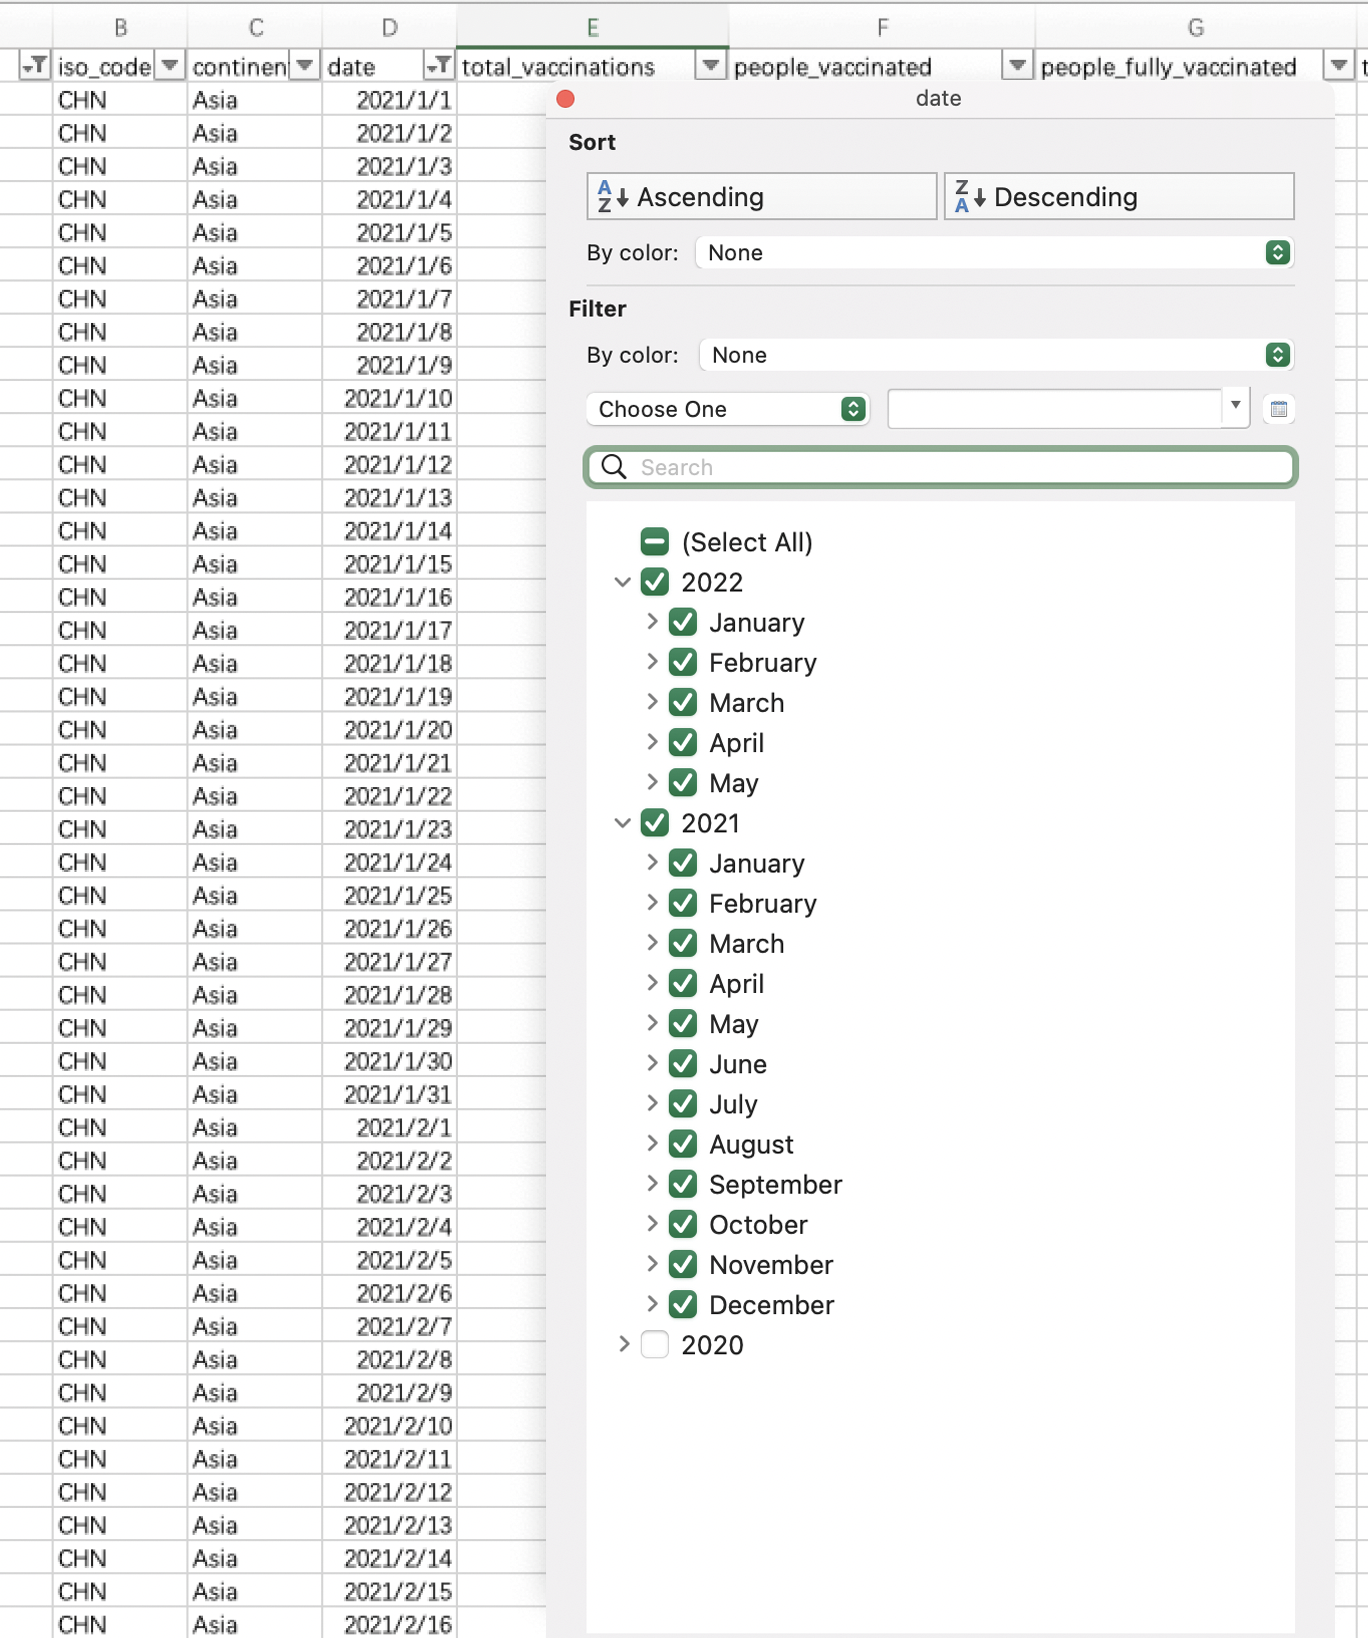
我们首先进行数据的筛选,然后我们在location字段中只勾选中国。

然后我们选择日期为2021年1月至2022年5月。
然后我们选中new_vaccinations字段,进行降序排序。
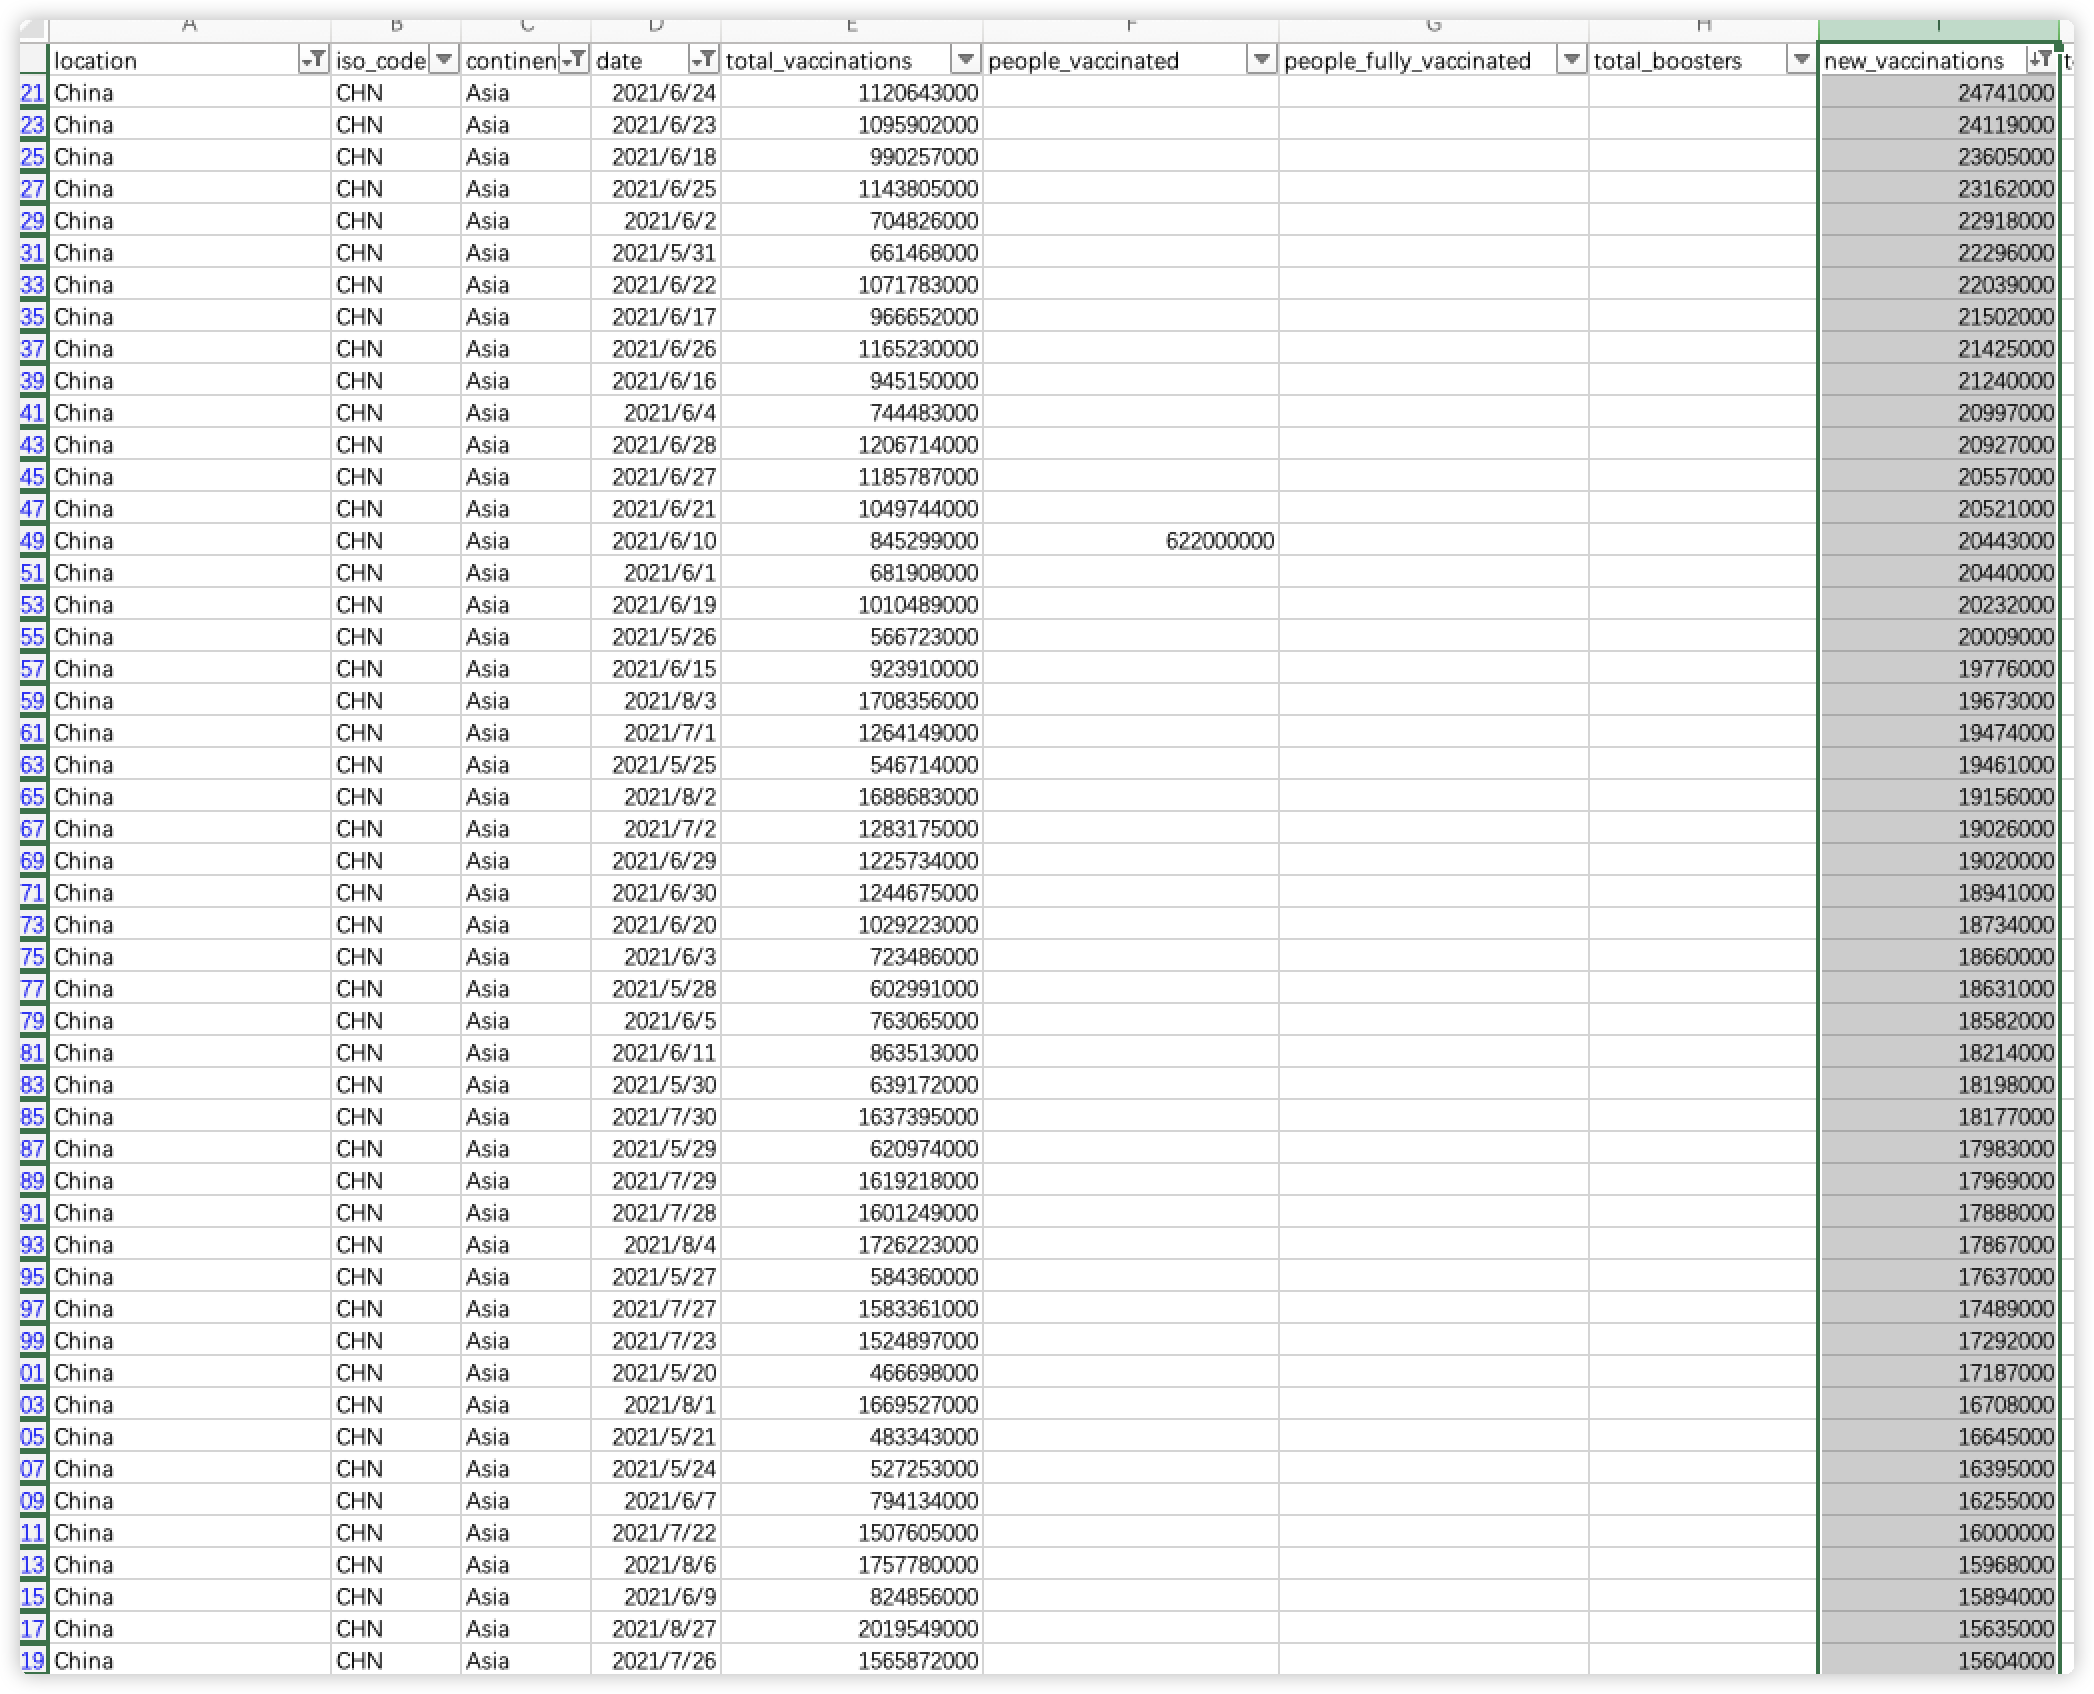
可以发现,在2021年6月24日,中国接种了截止目前位置最高的疫苗接种剂次,达到了24741000针次;而第二至第四的接种次数分别在6月23日、6月18日和6月5日,都集中在了这一段世界。这段时间的接种次数与中国疫苗的研发进展密不可分,在这段时间内中国完成了加强针的研发,并且大规模生产。
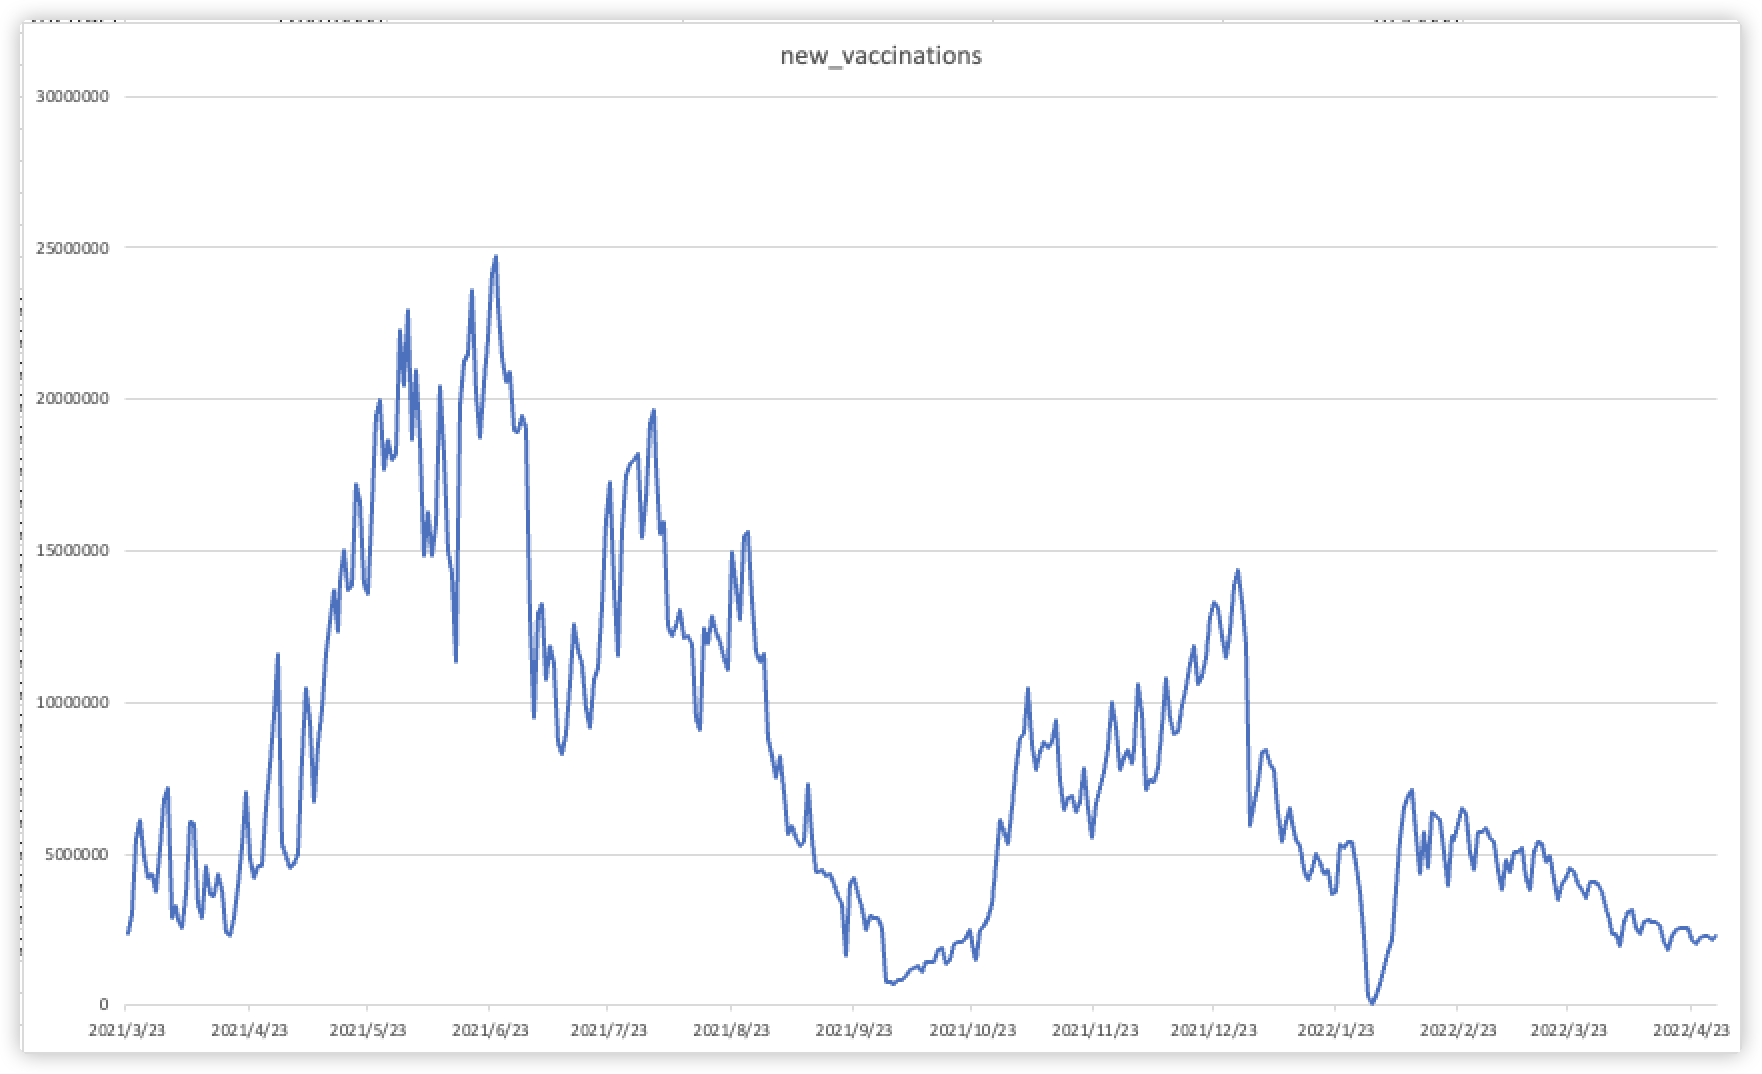
我们以折线统计图形势展现了中国从2021年1月至2022年5月每天的疫苗接种量的情况,可以看出疫苗的中有三次小高峰分别出现在2021年5月至6月;2021年8月至9月;2021年12月至2022年1月。这三次高峰对应着中国开展的新冠疫苗第一针接种、新冠疫苗第二针接种以及第三针加强针接种,三次接种人数是逐渐减少的。
总的来说,中国疫苗接种比例在全球中排行14,并且在2021年6月24日中国的接种人次最多,高达24741000针次。
Question 3: 新冠疫情对人的生命健康产生了较大的威胁和影响,致死率不容忽略,截止到2022年5月,新冠疫情已经造成全球多少人的死亡?哪个国家死亡的人数最多,其死亡率为多少?死亡率最小的国家又是哪一个?
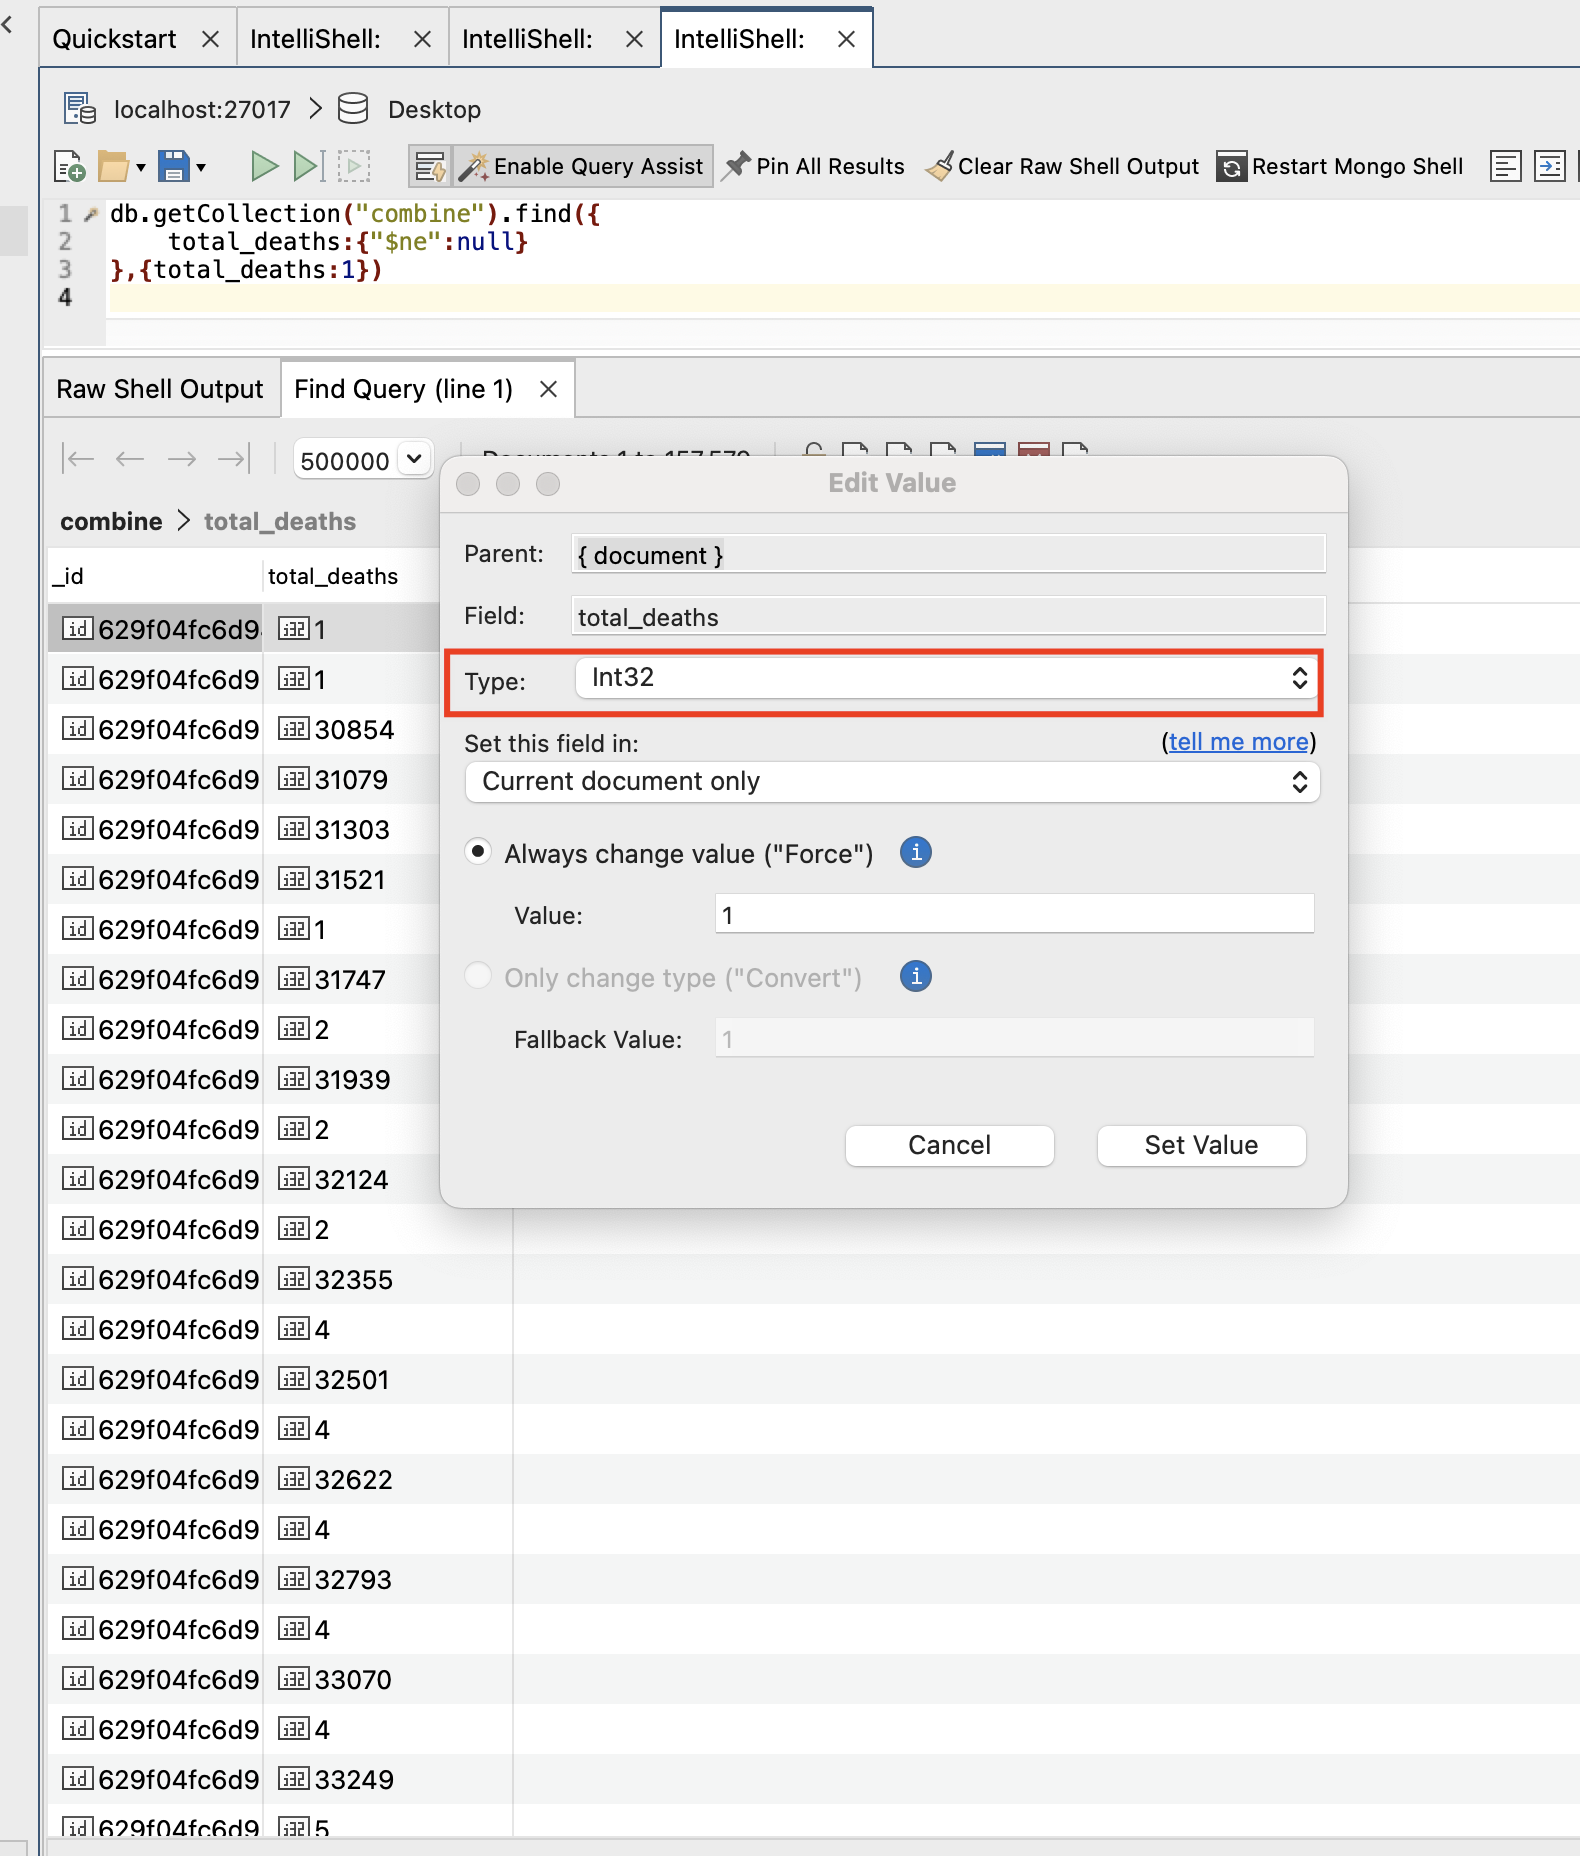
与Question2一样,total_deaths字段为string,需要转换成int型,因此我们执行下面的命令:
db.combine.find().forEach( function (x) {
    if(x.total_deaths!=null){
        x.total_deaths = NumberInt(x.total_deaths);
        db.combine.save(x);
    }
});
执行完毕后,total_deaths全部为int型:
在此基础上,我们就可以进行这个问题的分析和解决。为了得到全球目前死亡人数,我们应该首先获取所有国家的截止目前的死亡人数,获取方法为mongodb中执行以下命令:
db.getCollection("combine").aggregate(
{
    $match:{
        continent:{$in:['Oceania','Asia','Africa','Sounth America','North America','Europe']},
        total_deaths:{"$ne":null},
        total_deaths_per_million:{"$ne":null}
    }
},
{
    $group:{
        _id:'$location',
        total_deaths:{$max:"$total_deaths"},
        total_deaths_per_million:{$max:"$total_deaths_per_million"}

    }
},
{
    $sort:{total_deaths:-1}
}
)
结果如下:
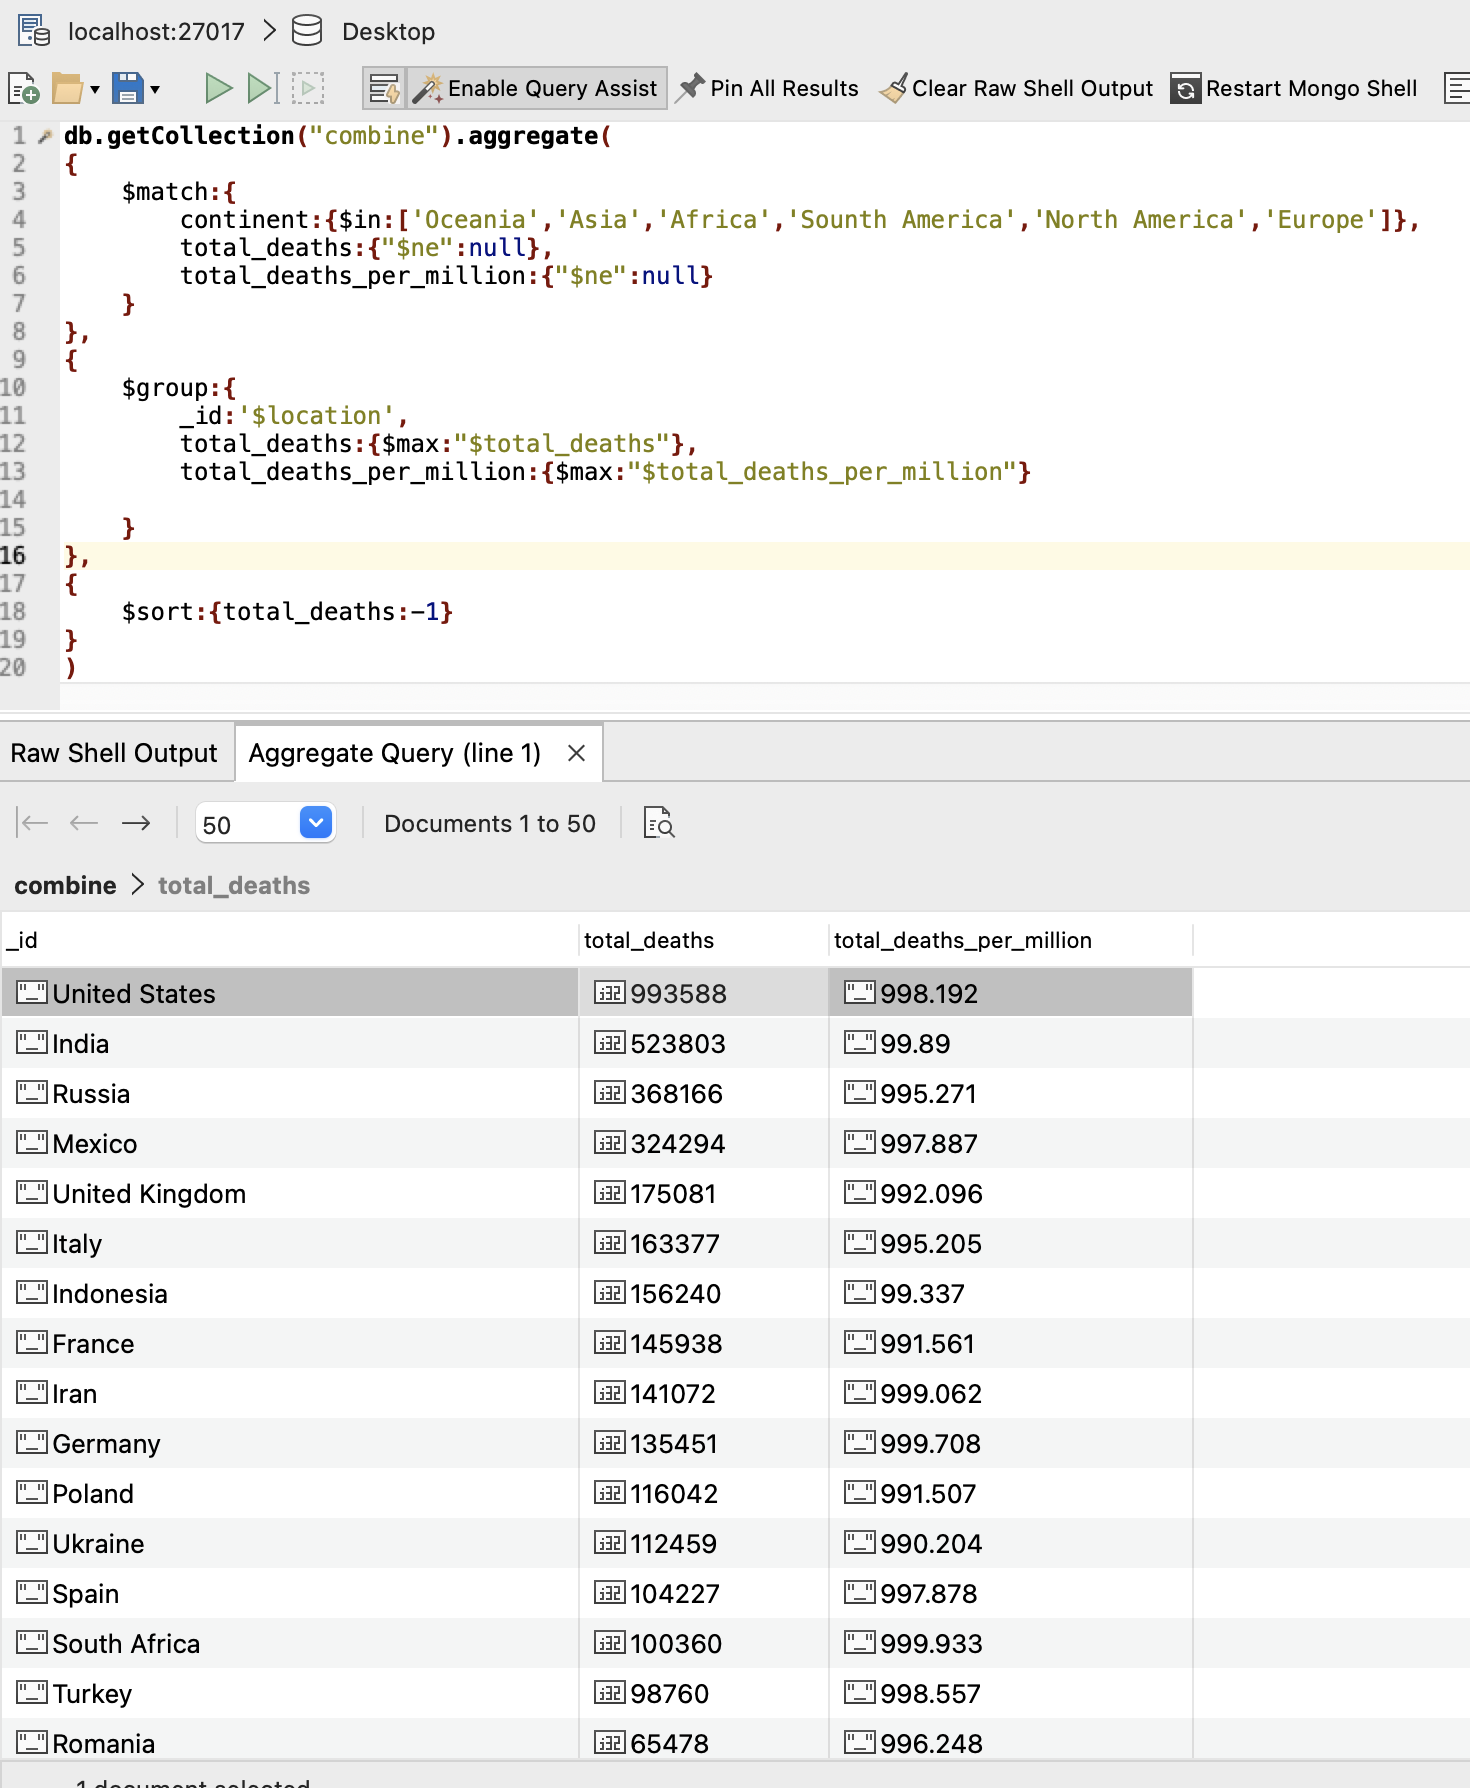
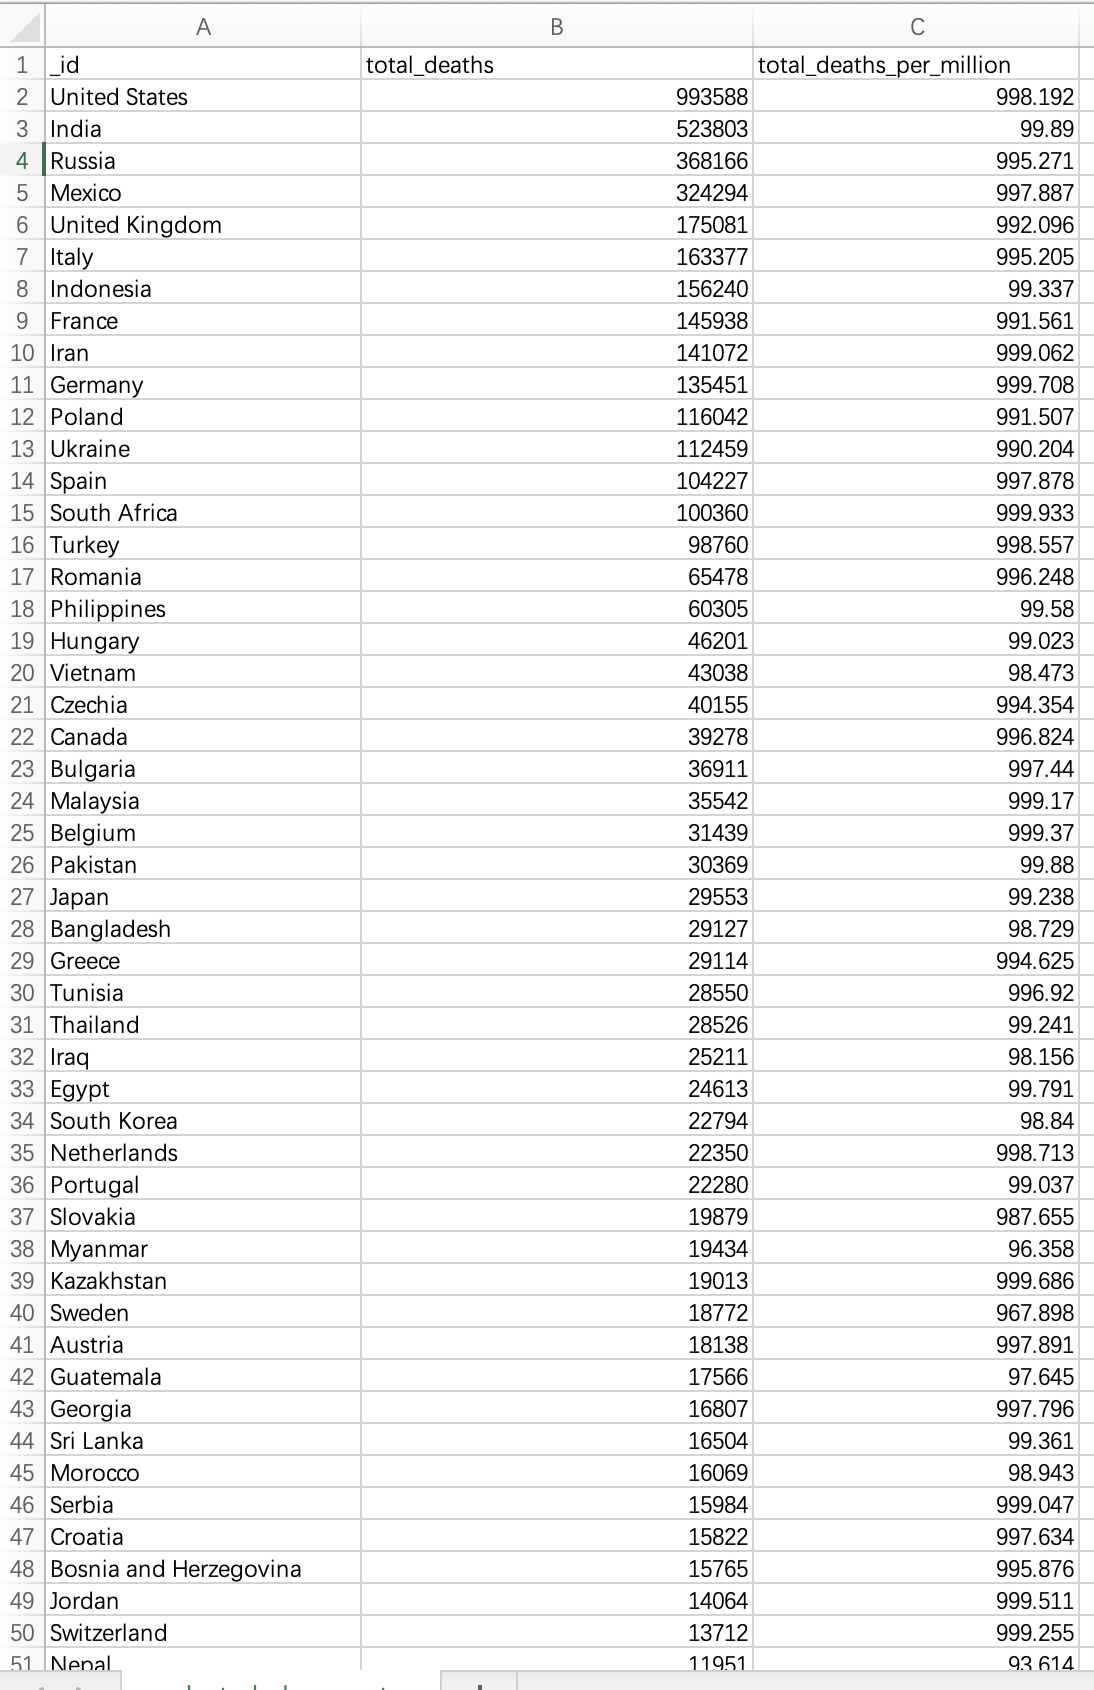
我们在命令中同样以国家分类,查询了他们截止到目前为止的死亡人数和死亡率,当然也排除了没有死亡人数和死亡率数据统计的相关国家,然后按照死亡人数降序排序。我们可以得知,United States有最多人数的死亡,达到了993588,其致死率达到了每million人中有998.192人死亡,是一个相当可怕的数据。不同国家总死亡人数和死亡率如下图:
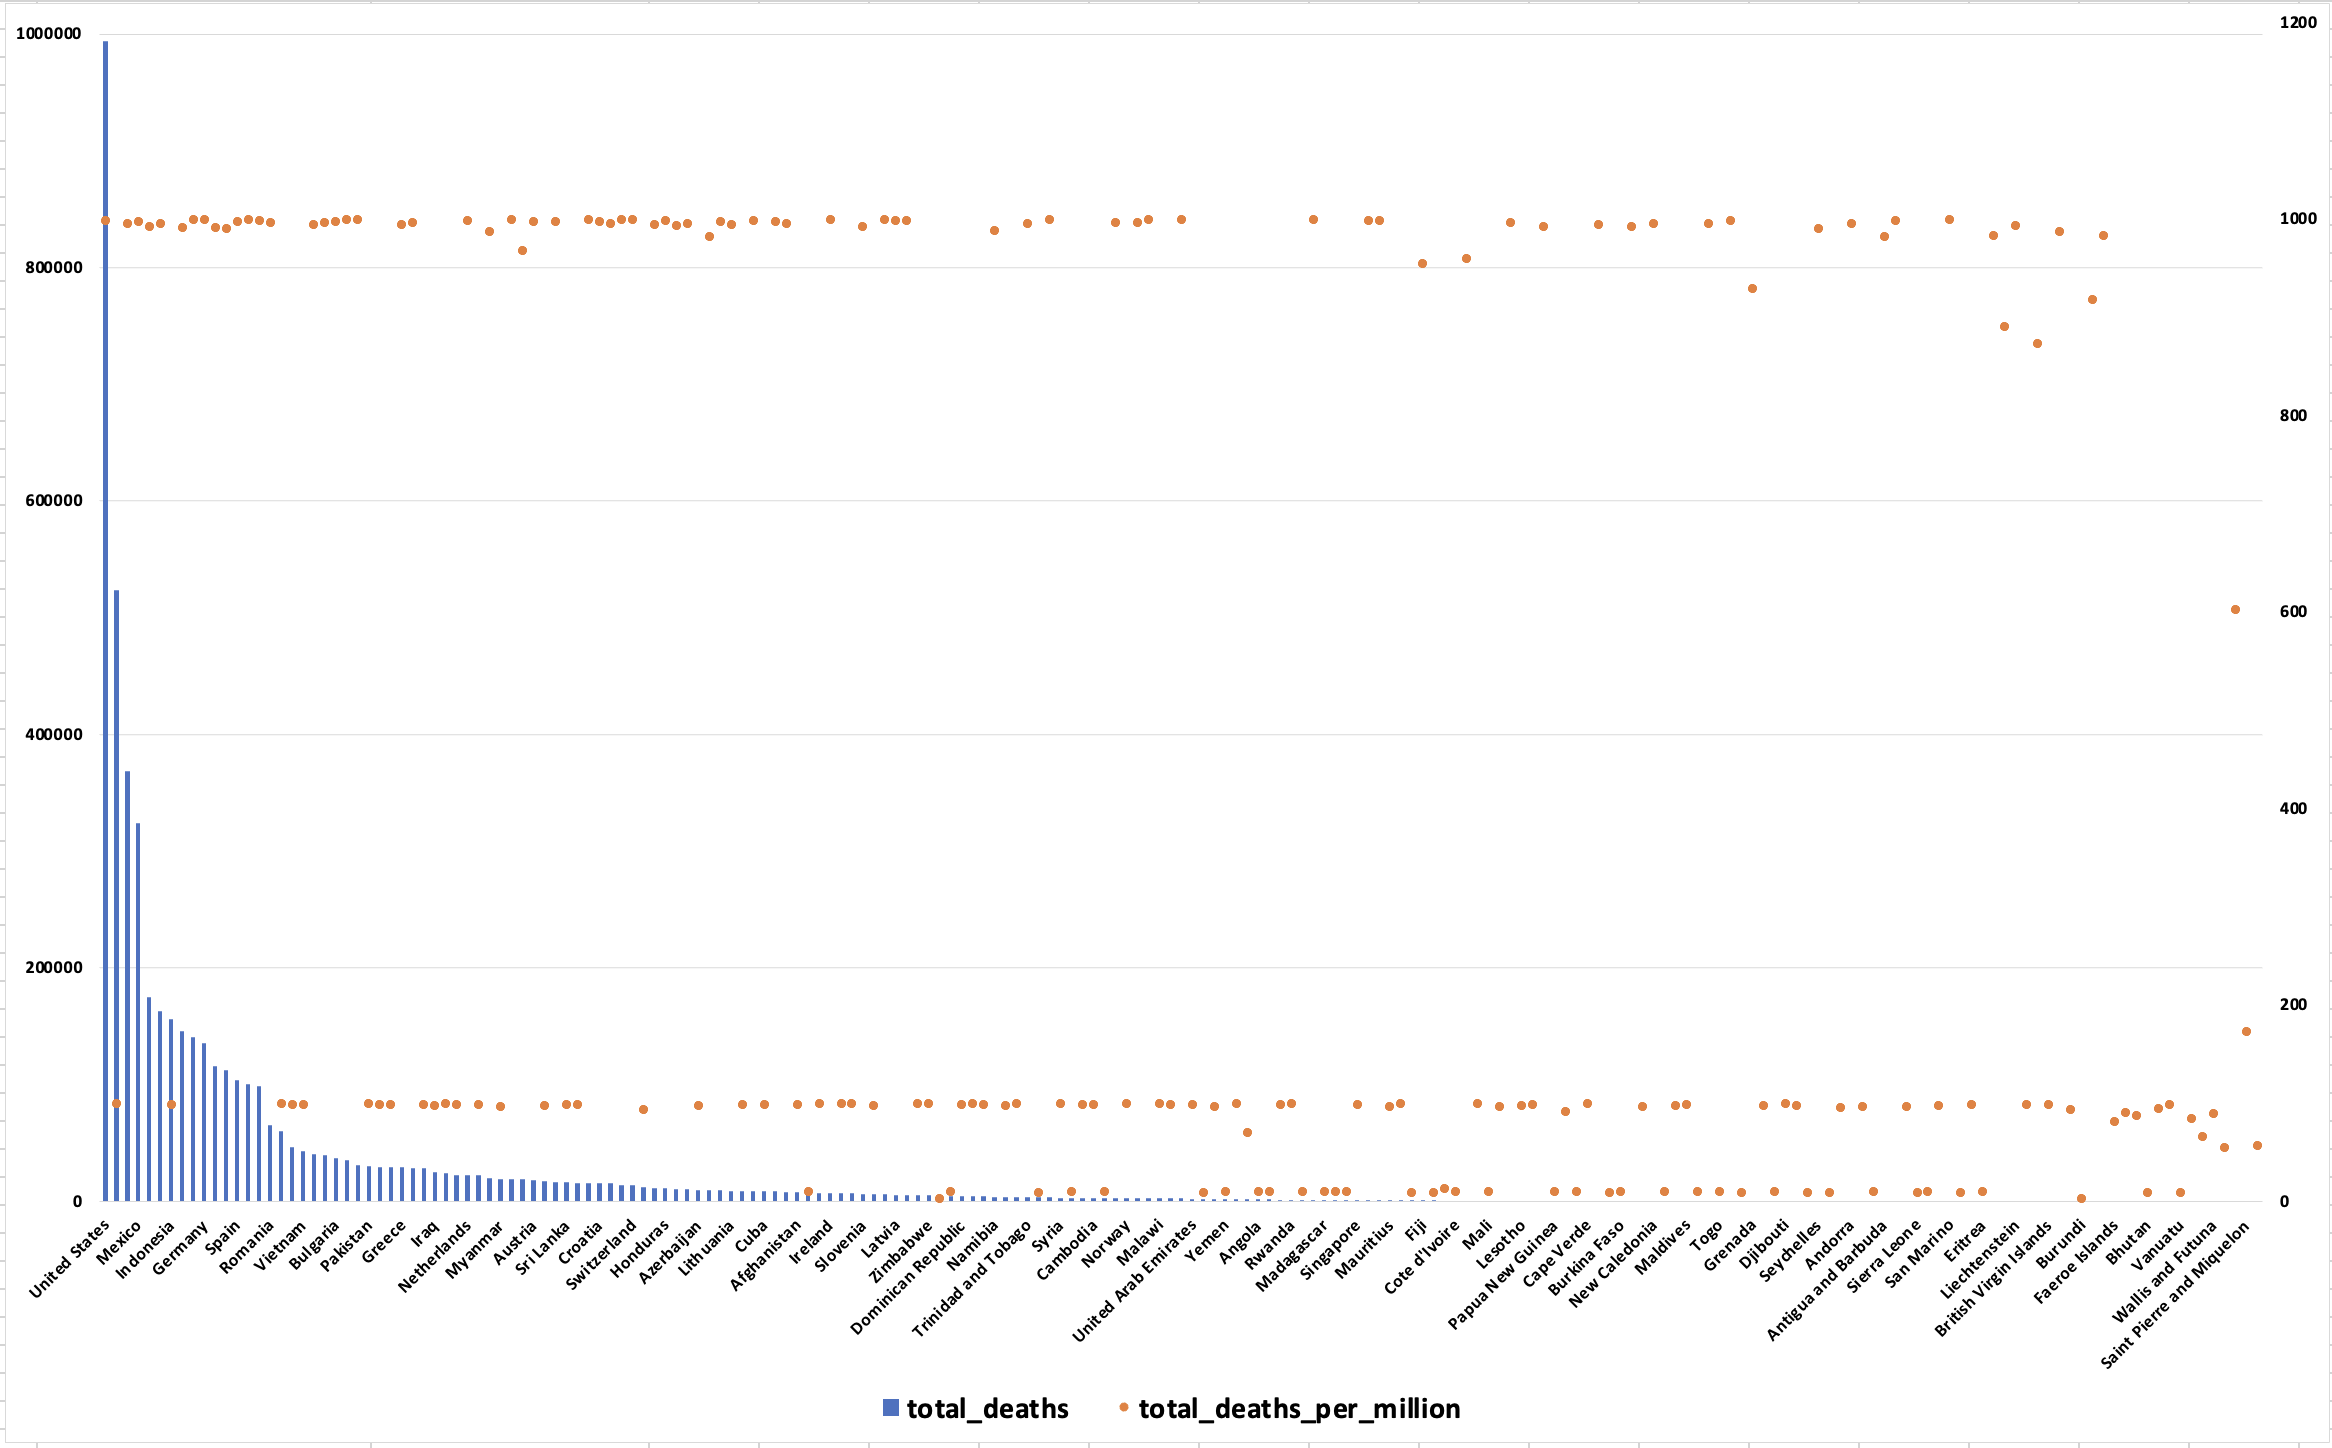
可以看出United States几乎同时拥有最高的死亡人数以及死亡率。
为了更加方便地计算总死亡人数,我们将该结果数据全部导出为csv,然后在excel中打开并处理。
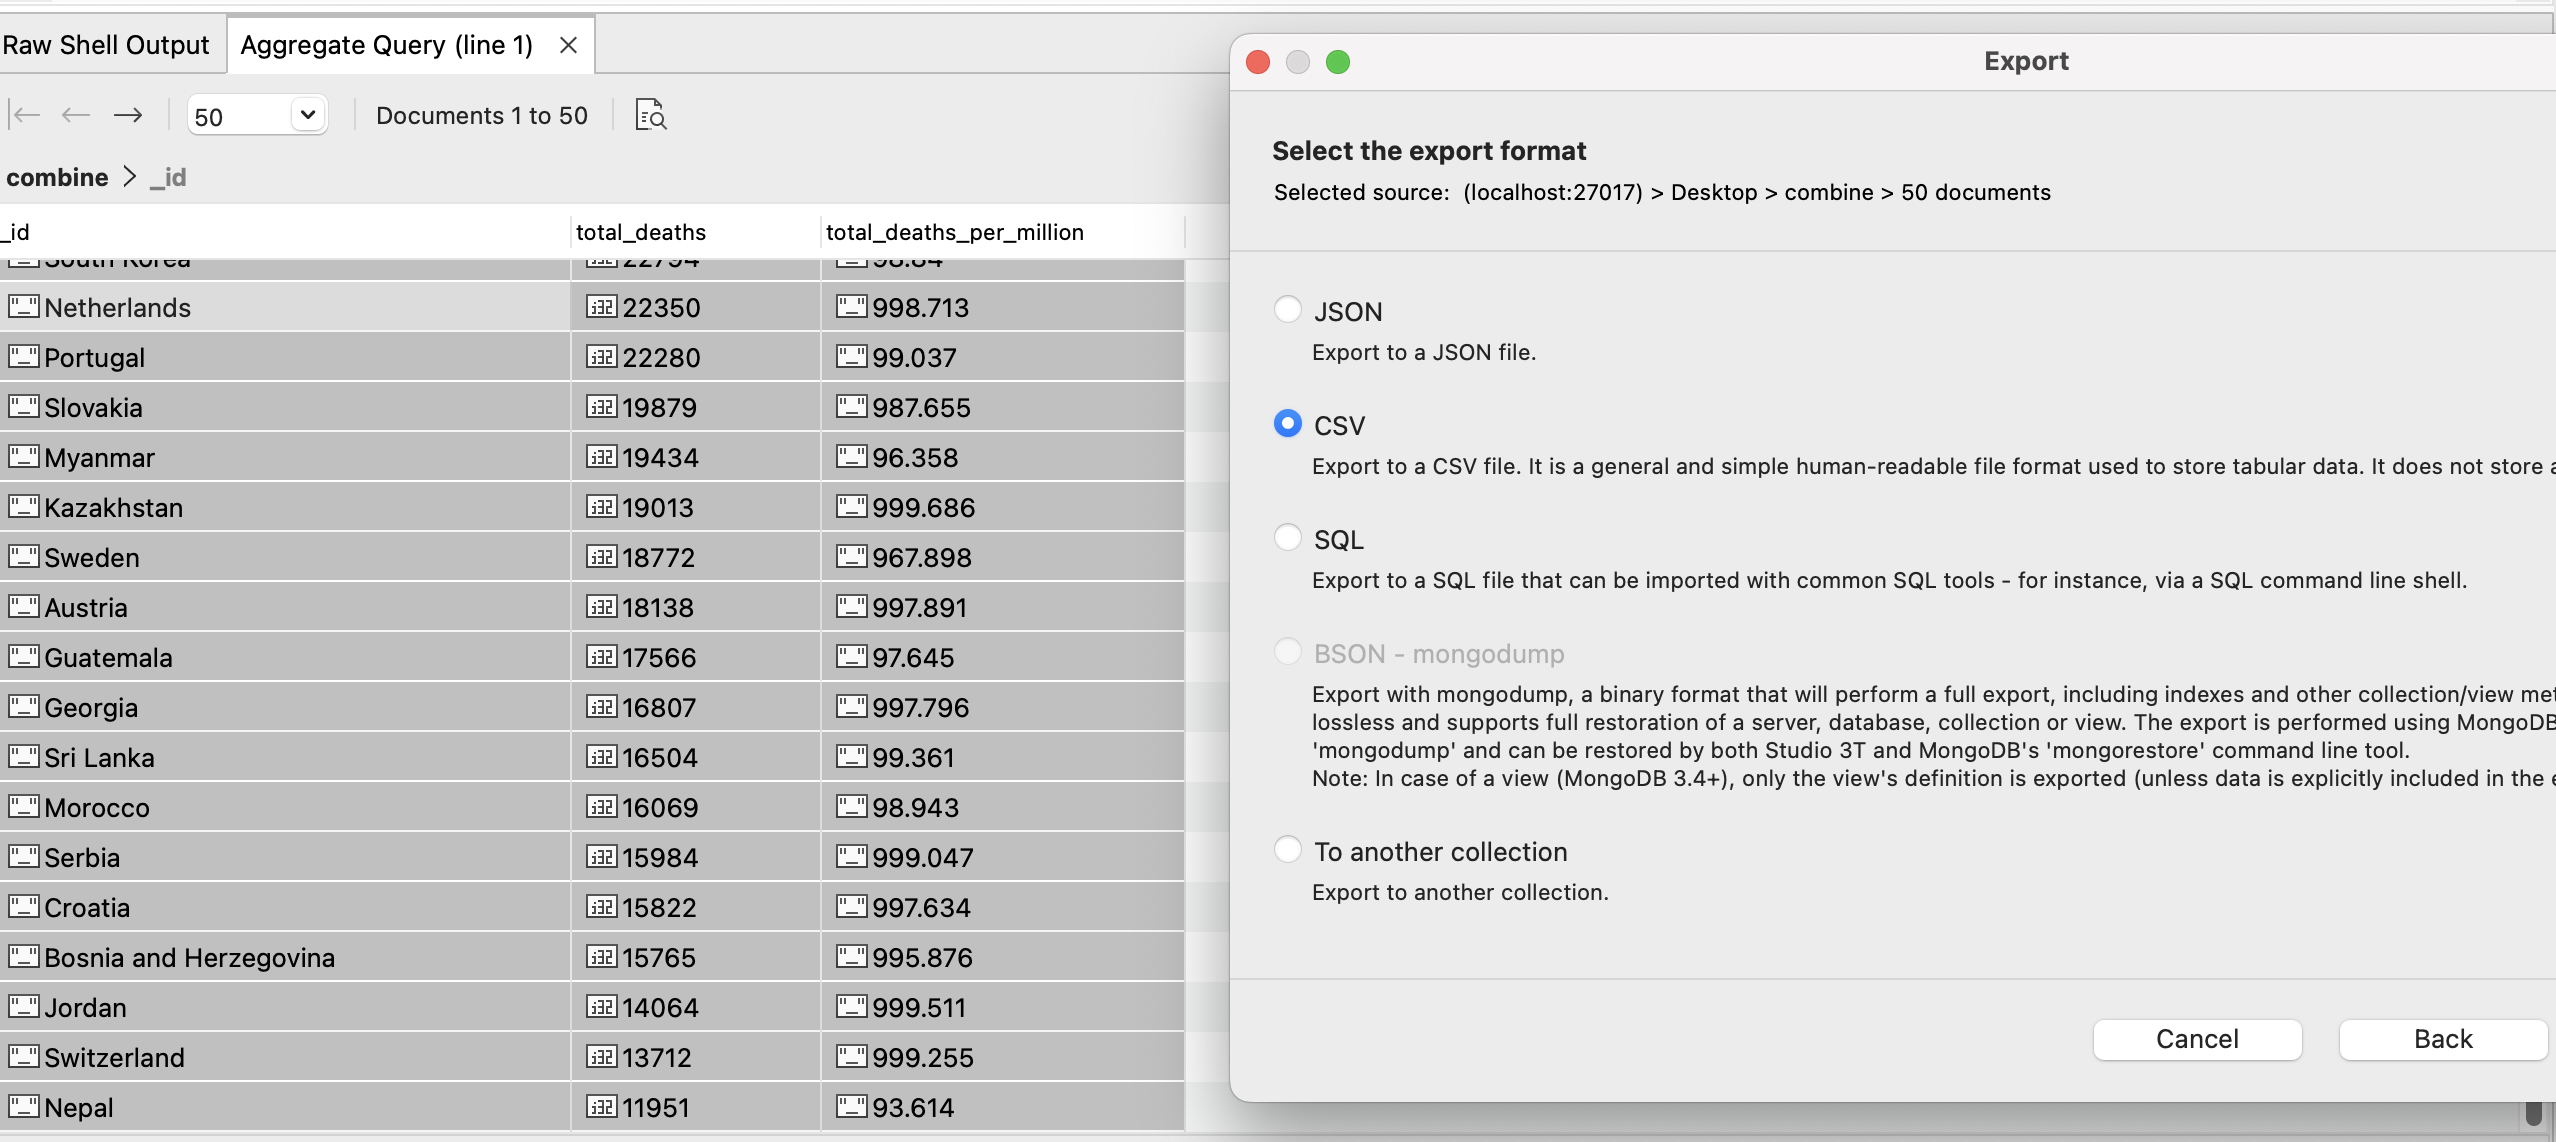
然后我们创建一个数据透视表,获取total_deaths列的总和:
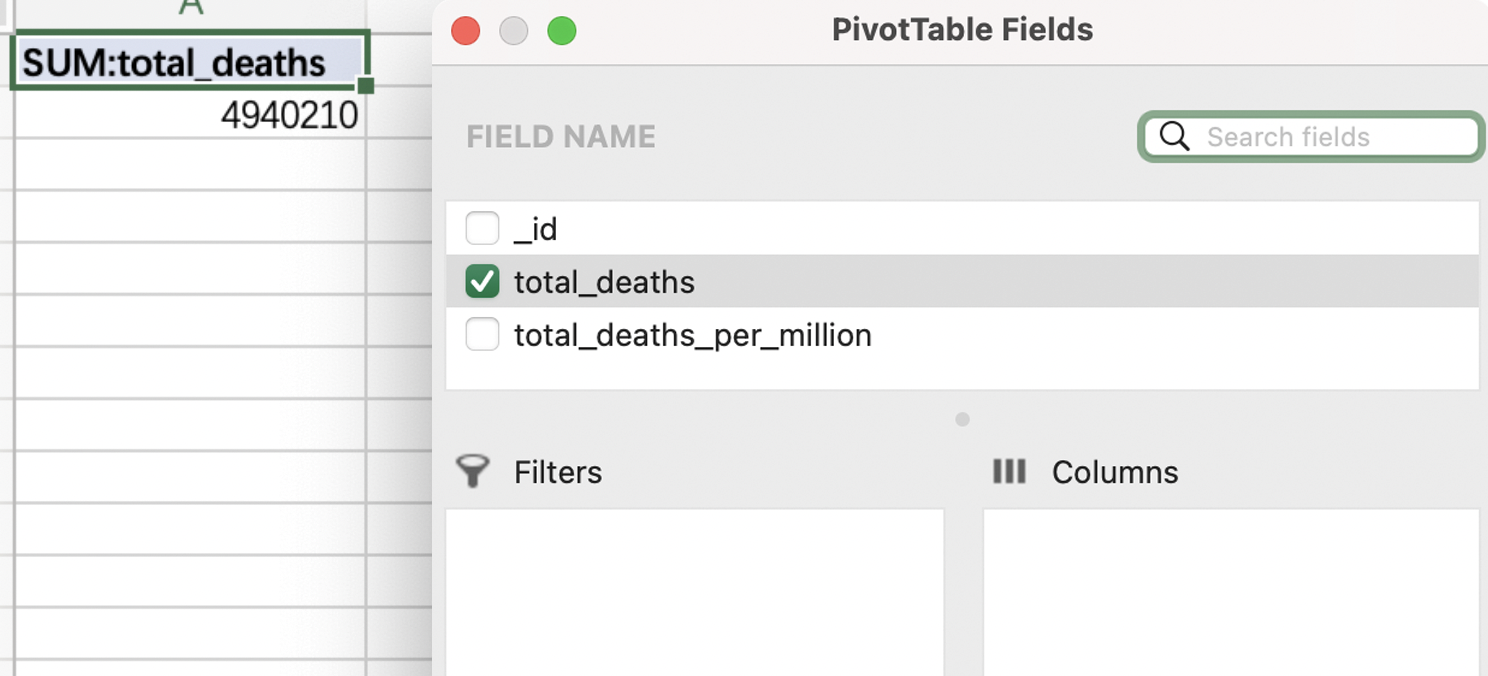
我们也可以直接使用excel中的SUM函数,输入=SUM(B2:B198),并且按下回车,则可以获取所选单元格内数据总和。
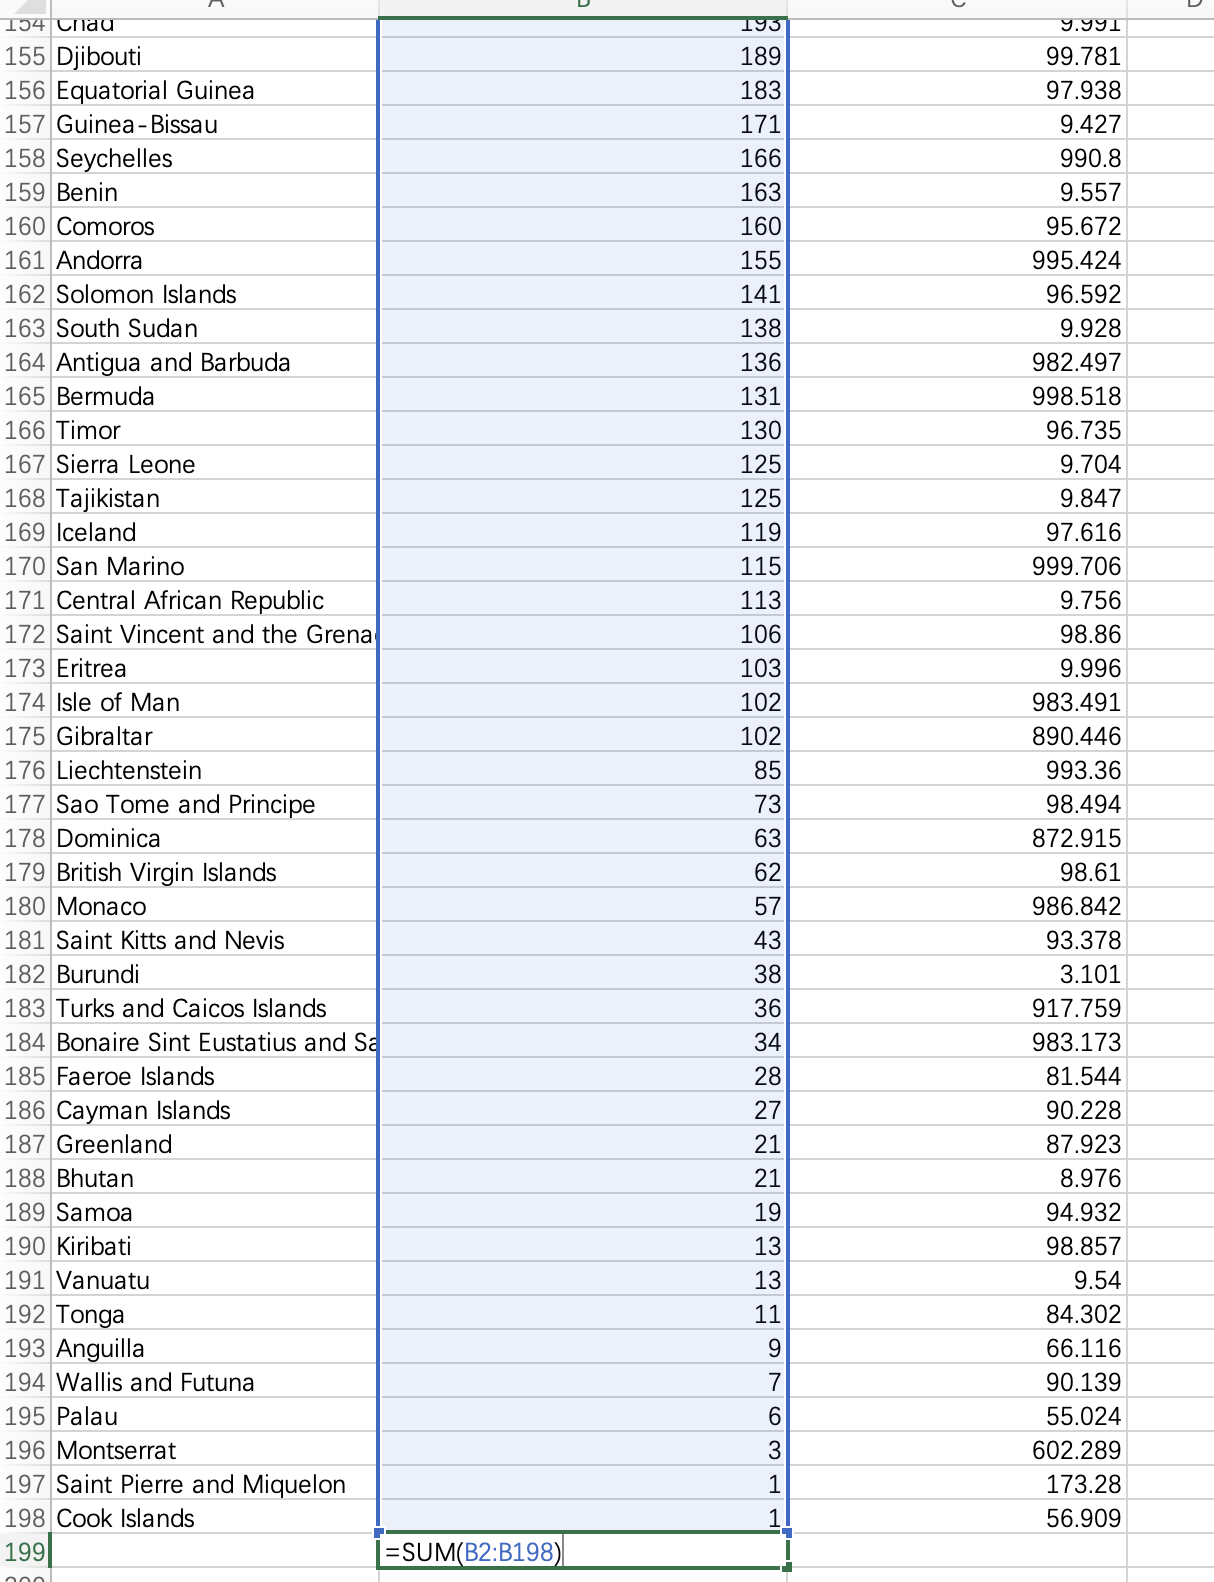
因此我们可以得到全球总死亡数在2022年5月前已经达到了4940210例。
对于死亡率最小的国家,我们直接在excel中选取total_death_per_million进行升序排列:
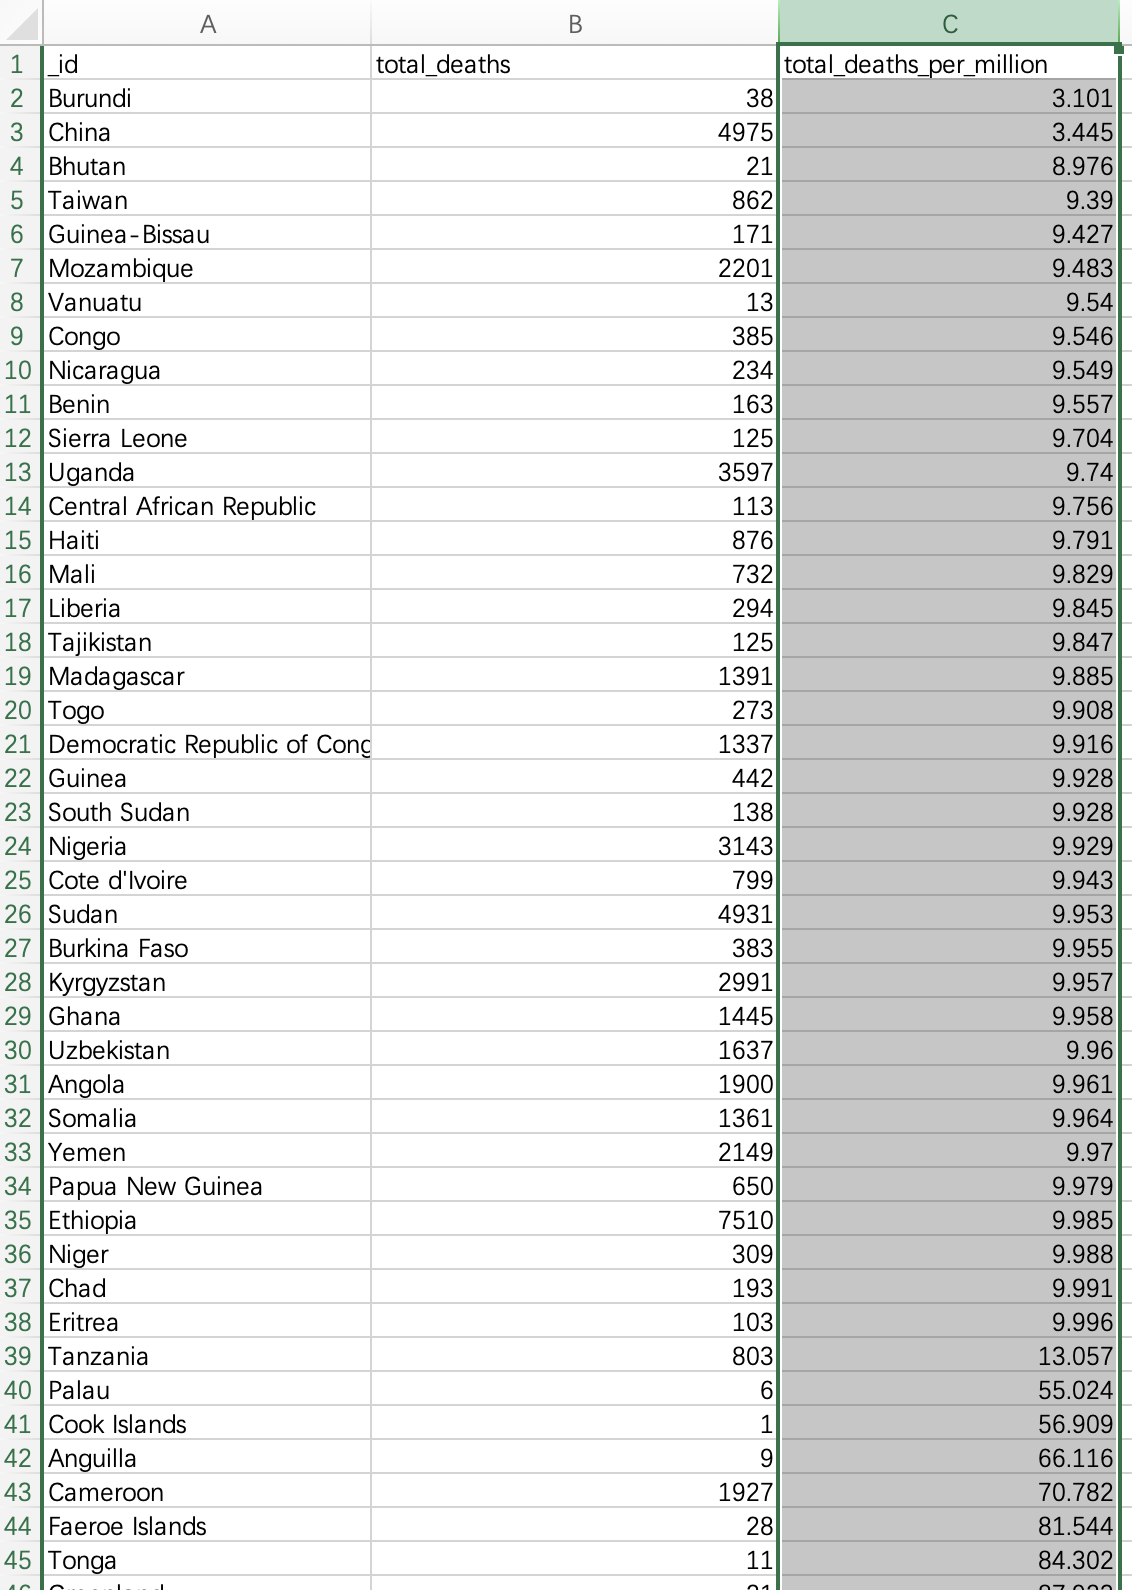
可以知道Burundi拥有最少的死亡率,每million人仅有3.101人死亡;而中国作为世界第一人口国家也在每million人仅有3.445人死亡,排行第二;在这之后的死亡率则拥有较大差距,不同国家死亡率的数据统计图如下:
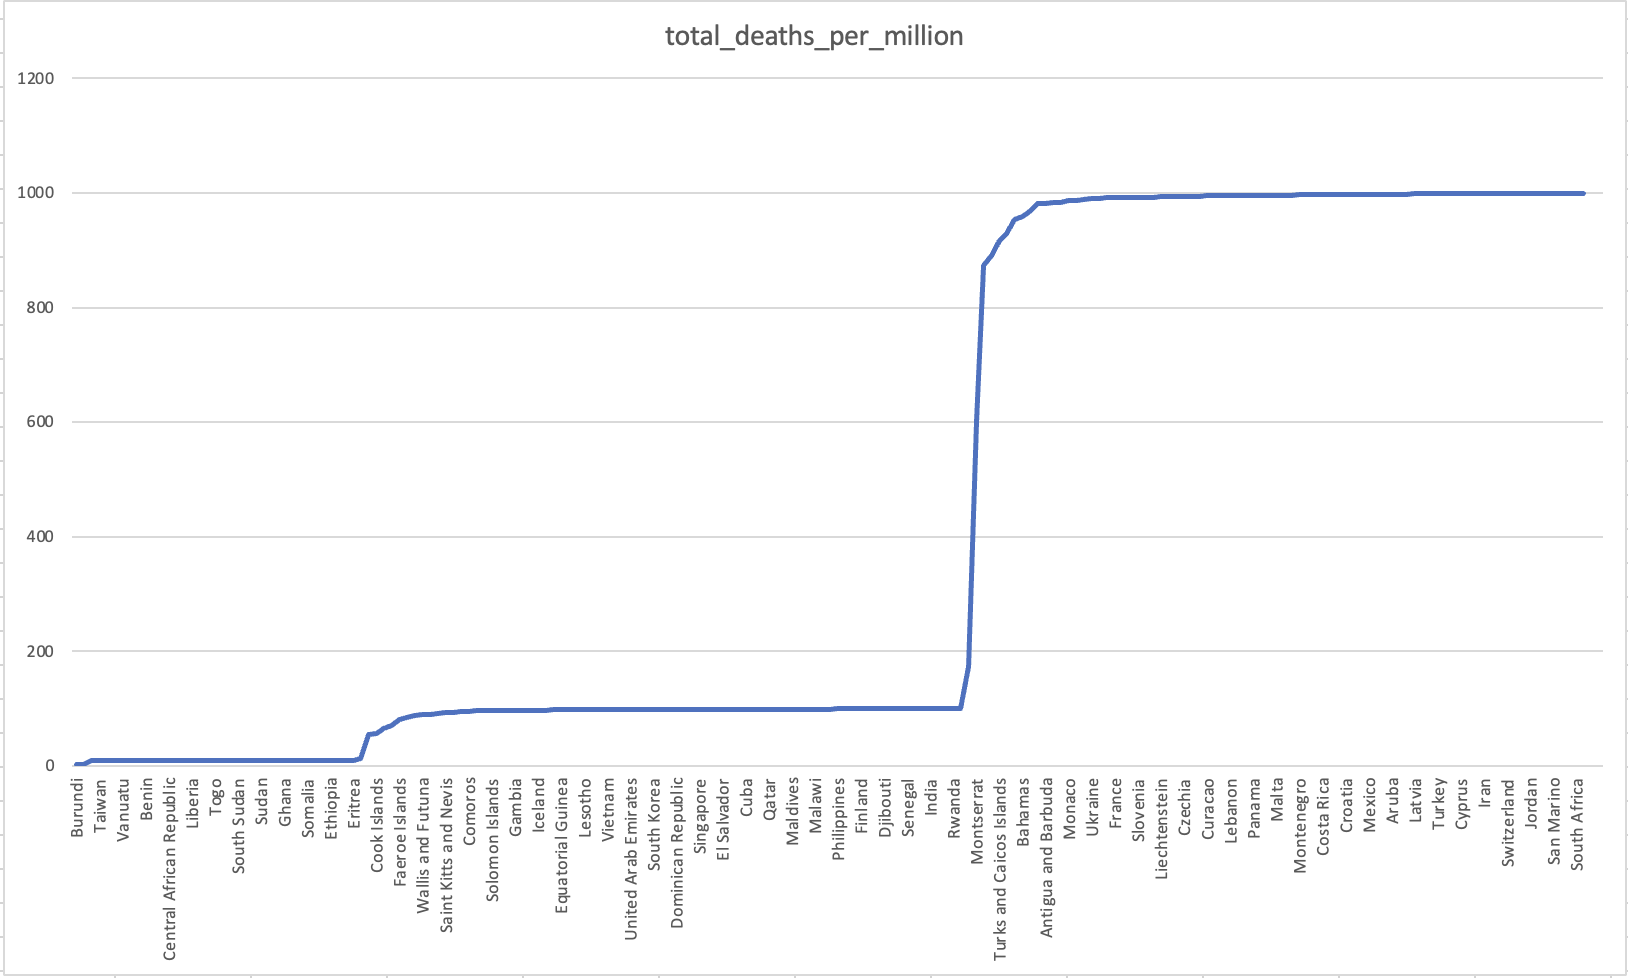
总而言之,截止到2022年5月,新冠疫情已经造成了全球4940210例死亡,其中United States死亡人数最多,达到了993588人,死亡率达到每million有998.192人死亡。死亡率最低的国家是Burundi,为每million人有3.101人死亡。
Links (Google Drive)
Dataset 1: owid-covid-data(JSON)
https://drive.google.com/file/d/1VTISgrtp_bMDK_Y2ut0MU1N6RP-VDu5b/view?usp=sharing
Dataset 2: Coronavirus COVID-19 Vaccinations(CSV)
https://drive.google.com/file/d/14hBoLSdDCeIbsCAFgiTz-HPe0q_90PMv/view?usp=sharing
Dataset 3: Final combined data(Excel)
Conclusion
The impact of COVID-19 is still ongoing and the global epidemic environment is a time of severe testing that will bring challenges to businesses and governments, as COVID-19 brings harm, governments and businesses have to estimate the trend of the disease and propose countermeasures. For companies, faced with a rapidly declining global economy, they need to adapt to the current situation as quickly as possible, to stay afloat, to stay current and adaptable to the new economy, to make flexible adjustments to their business strategies based on the project, and to react quickly to the fluctuations of each epidemic cycle. For the government, it will be able to visualise the trend of COVID-19 vaccination and the number of COVID-19 infections and make decisions on the development trend of the epidemic, on the other hand, it will be able to make predictions based on the data and launch timely epidemic support policies.