调优pprof
分析程序运行时间,cpu利用率情况
- 用time
$ time go run test2.go
&{{0 0} 张三 0}

real	0m0.843s
user	0m0.216s
sys	0m0.389s
real:从程序开始到结束,实际度过的时间;user:程序在用户态度过的时间;sys:程序在内核态度过的时间。
- /usr/bin/time 指令
$ /usr/bin/time -v go run test2.go

	Command being timed: "go run test2.go"
	User time (seconds): 0.12
	System time (seconds): 0.06
	Percent of CPU this job got: 115%
	Elapsed (wall clock) time (h:mm:ss or m:ss): 0:00.16
	Average shared text size (kbytes): 0
	Average unshared data size (kbytes): 0
	Average stack size (kbytes): 0
	Average total size (kbytes): 0
	Maximum resident set size (kbytes): 41172
	Average resident set size (kbytes): 0
	Major (requiring I/O) page faults: 1
	Minor (reclaiming a frame) page faults: 15880
	Voluntary context switches: 897
	Involuntary context switches: 183
	Swaps: 0
	File system inputs: 256
	File system outputs: 2664
	Socket messages sent: 0
	Socket messages received: 0
	Signals delivered: 0
	Page size (bytes): 4096
	Exit status: 0
- CPU占用率;
- 内存使用情况;
- Page Fault 情况;
- 进程切换情况;
- 文件系统IO;
- Socket 使用情况;
- ……
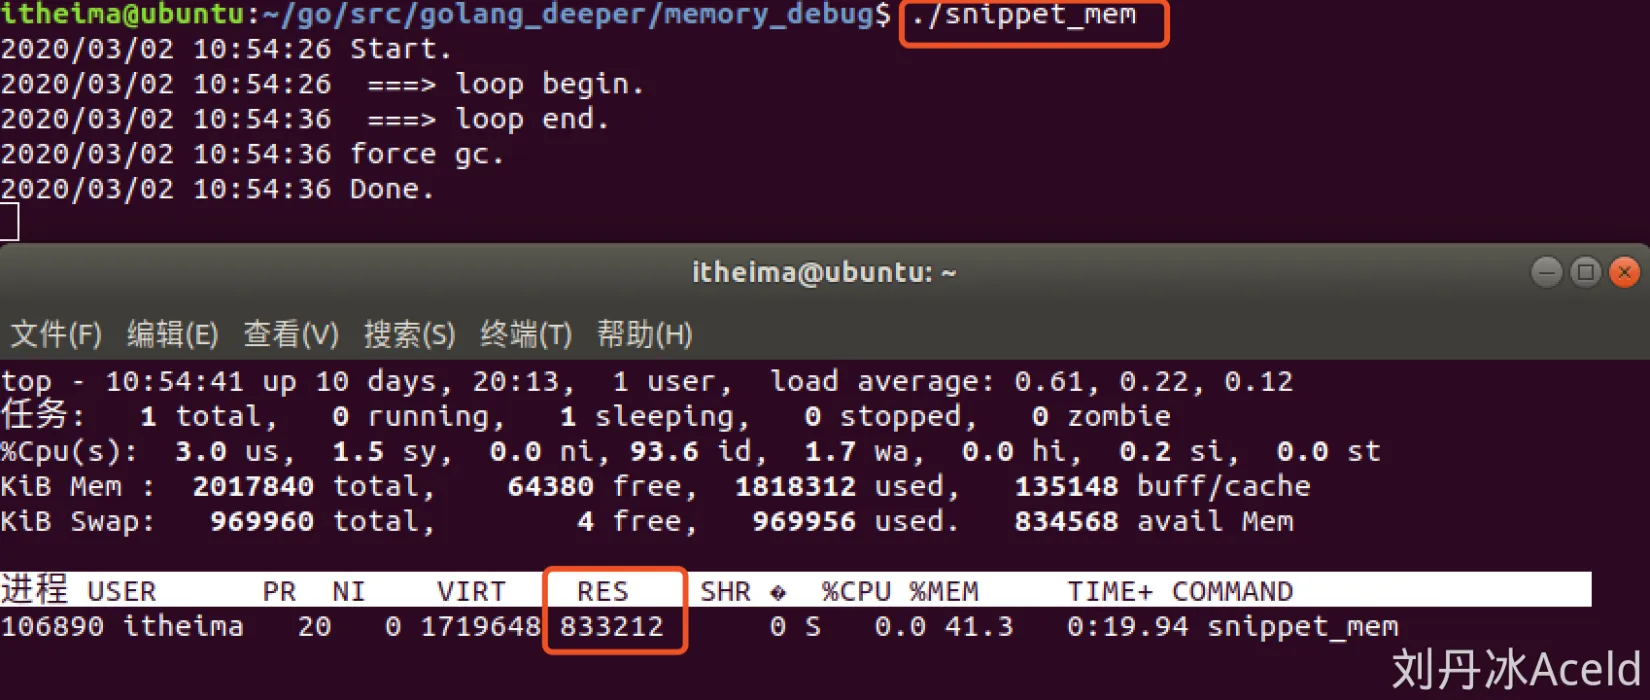
如何分析golang程序的内存使用情况?
package main

import (
    "log"
    "runtime"
    "time"
)

func test() {
    //slice 会动态扩容,用slice来做堆内存申请
    container := make([]int, 8)

    log.Println(" ===> loop begin.")
    for i := 0; i < 32*1000*1000; i++ {
        container = append(container, i)
    }
    log.Println(" ===> loop end.")
}

func main() {
    log.Println("Start.")

    test()

    log.Println("force gc.")
    runtime.GC() //强制调用gc回收

    log.Println("Done.")

    time.Sleep(3600 * time.Second) //睡眠,保持程序不退出
}
$go build -o snippet_mem && ./snippet_mem
$top -p $(pidof snippet_mem)
(2) GODEBUG与gctrace
执行snippet_mem程序之前添加环境变量GODEBUG='gctrace=1’来跟踪打印垃圾回收器信息
$ GODEBUG='gctrace=1' ./snippet_mem
设置gctrace=1会使得垃圾回收器在每次回收时汇总所回收内存的大小以及耗时,并将这些内容汇总成单行内容打印到标准错误输出中。格式如下:
gc 17 @0.149s 1%: 0.004+36+0.003 ms clock, 0.009+0/0.051/36+0.006 ms cpu, 181->181->101 MB, 182 MB goal, 2 P
gc 17: Gc 调试编号为17@0.149s:此时程序已经执行了0.149s1%: 0.149s中其中gc模块占用了1%的时间0.004+36+0.003 ms clock: 垃圾回收的时间,分别为STW(stop-the-world)清扫的时间+并发标记和扫描的时间+STW标记的时间0.009+0/0.051/36+0.006 ms cpu: 垃圾回收占用cpu时间181->181->101 MB: GC开始前堆内存181M, GC结束后堆内存181M,当前活跃的堆内存101M182 MB goal: 全局堆内存大小2 P: 本次GC使用了2个P(调度器中的Processer)
如果每条信息最后,以(forced)结尾,那么该信息是由runtime.GC()调用触发
(3) runtime.ReadMemStats
利用 runtime库里的ReadMemStats()方法
package main

import (
    "log"
    "runtime"
    "time"
)

func readMemStats() {

    var ms runtime.MemStats

    runtime.ReadMemStats(&ms)

    log.Printf(" ===> Alloc:%d(bytes) HeapIdle:%d(bytes) HeapReleased:%d(bytes)", ms.Alloc, ms.HeapIdle, ms.HeapReleased)
}

func test() {
    //slice 会动态扩容,用slice来做堆内存申请
    container := make([]int, 8)

    log.Println(" ===> loop begin.")
    for i := 0; i < 32*1000*1000; i++ {
        container = append(container, i)
        if ( i == 16*1000*1000) {
            readMemStats()
        }
    }

    log.Println(" ===> loop end.")
}

func main() {
    log.Println(" ===> [Start].")

    readMemStats()
    test()
    readMemStats()

    log.Println(" ===> [force gc].")
    runtime.GC() //强制调用gc回收

    log.Println(" ===> [Done].")
    readMemStats()

    go func() {
        for {
            readMemStats()
            time.Sleep(10 * time.Second)
        }
    }()

    time.Sleep(3600 * time.Second) //睡眠,保持程序不退出
}
这里我们, 封装了一个函数readMemStats(),这里面主要是调用runtime中的ReadMemStats()方法获得内存信息,然后通过log打印出来。
执行代码:
dorachen@Lunatic demo2 % go run demo2.go
2024/07/20 22:33:37  ===> [Start].
2024/07/20 22:33:37  ===> Alloc:124648(bytes) HeapIdle:3530752(bytes) HeapReleased:3497984(bytes)
2024/07/20 22:33:37  ===> loop begin.
2024/07/20 22:33:37  ===> Alloc:154137896(bytes) HeapIdle:243621888(bytes) HeapReleased:96903168(bytes)
2024/07/20 22:33:37  ===> loop end.
2024/07/20 22:33:37  ===> Alloc:695566776(bytes) HeapIdle:247472128(bytes) HeapReleased:54829056(bytes)
2024/07/20 22:33:37  ===> [force gc].
2024/07/20 22:33:37  ===> [Done].
2024/07/20 22:33:37  ===> Alloc:143040(bytes) HeapIdle:942858240(bytes) HeapReleased:54796288(bytes)
2024/07/20 22:33:37  ===> Alloc:143960(bytes) HeapIdle:942858240(bytes) HeapReleased:54796288(bytes)
2024/07/20 22:33:47  ===> Alloc:144088(bytes) HeapIdle:942858240(bytes) HeapReleased:54796288(bytes)
2024/07/20 22:33:57  ===> Alloc:144776(bytes) HeapIdle:942850048(bytes) HeapReleased:250339328(bytes)
2024/07/20 22:34:07  ===> Alloc:144808(bytes) HeapIdle:942850048(bytes) HeapReleased:250339328(bytes)
2024/07/20 22:34:17  ===> Alloc:144840(bytes) HeapIdle:942850048(bytes) HeapReleased:250339328(bytes)
可以看到,打印[Done].之后那条trace信息,Alloc已经下降,即内存已被垃圾回收器回收。在2020/03/02 18:21:38和2020/03/02 18:21:48的两条trace信息中,HeapReleased开始上升,即垃圾回收器把内存归还给系统。
(4) pprof工具

import(
	"net/http"
	_ "net/http/pprof"
)

go func() {
	log.Println(http.ListenAndServe("0.0.0.0:10000", nil))
}()
加到上面代码:
package main

import (
    "log"
    "runtime"
    "time"
    "net/http"
    _ "net/http/pprof"
)

func readMemStats() {

    var ms runtime.MemStats

    runtime.ReadMemStats(&ms)

    log.Printf(" ===> Alloc:%d(bytes) HeapIdle:%d(bytes) HeapReleased:%d(bytes)", ms.Alloc, ms.HeapIdle, ms.HeapReleased)
}

func test() {
    //slice 会动态扩容,用slice来做堆内存申请
    container := make([]int, 8)

    log.Println(" ===> loop begin.")
    for i := 0; i < 32*1000*1000; i++ {
        container = append(container, i)
        if ( i == 16*1000*1000) {
            readMemStats()
        }
    }

    log.Println(" ===> loop end.")
}

func main() {


    //启动pprof
    go func() {
        log.Println(http.ListenAndServe("0.0.0.0:10000", nil))
    }()

    log.Println(" ===> [Start].")

    readMemStats()
    test()
    readMemStats()

    log.Println(" ===> [force gc].")
    runtime.GC() //强制调用gc回收

    log.Println(" ===> [Done].")
    readMemStats()

    go func() {
        for {
            readMemStats()
            time.Sleep(10 * time.Second)
        }
    }()

    time.Sleep(3600 * time.Second) //睡眠,保持程序不退出
}
即可通过浏览器访问:http://127.0.0.1:10000/debug/pprof/heap?debug=1
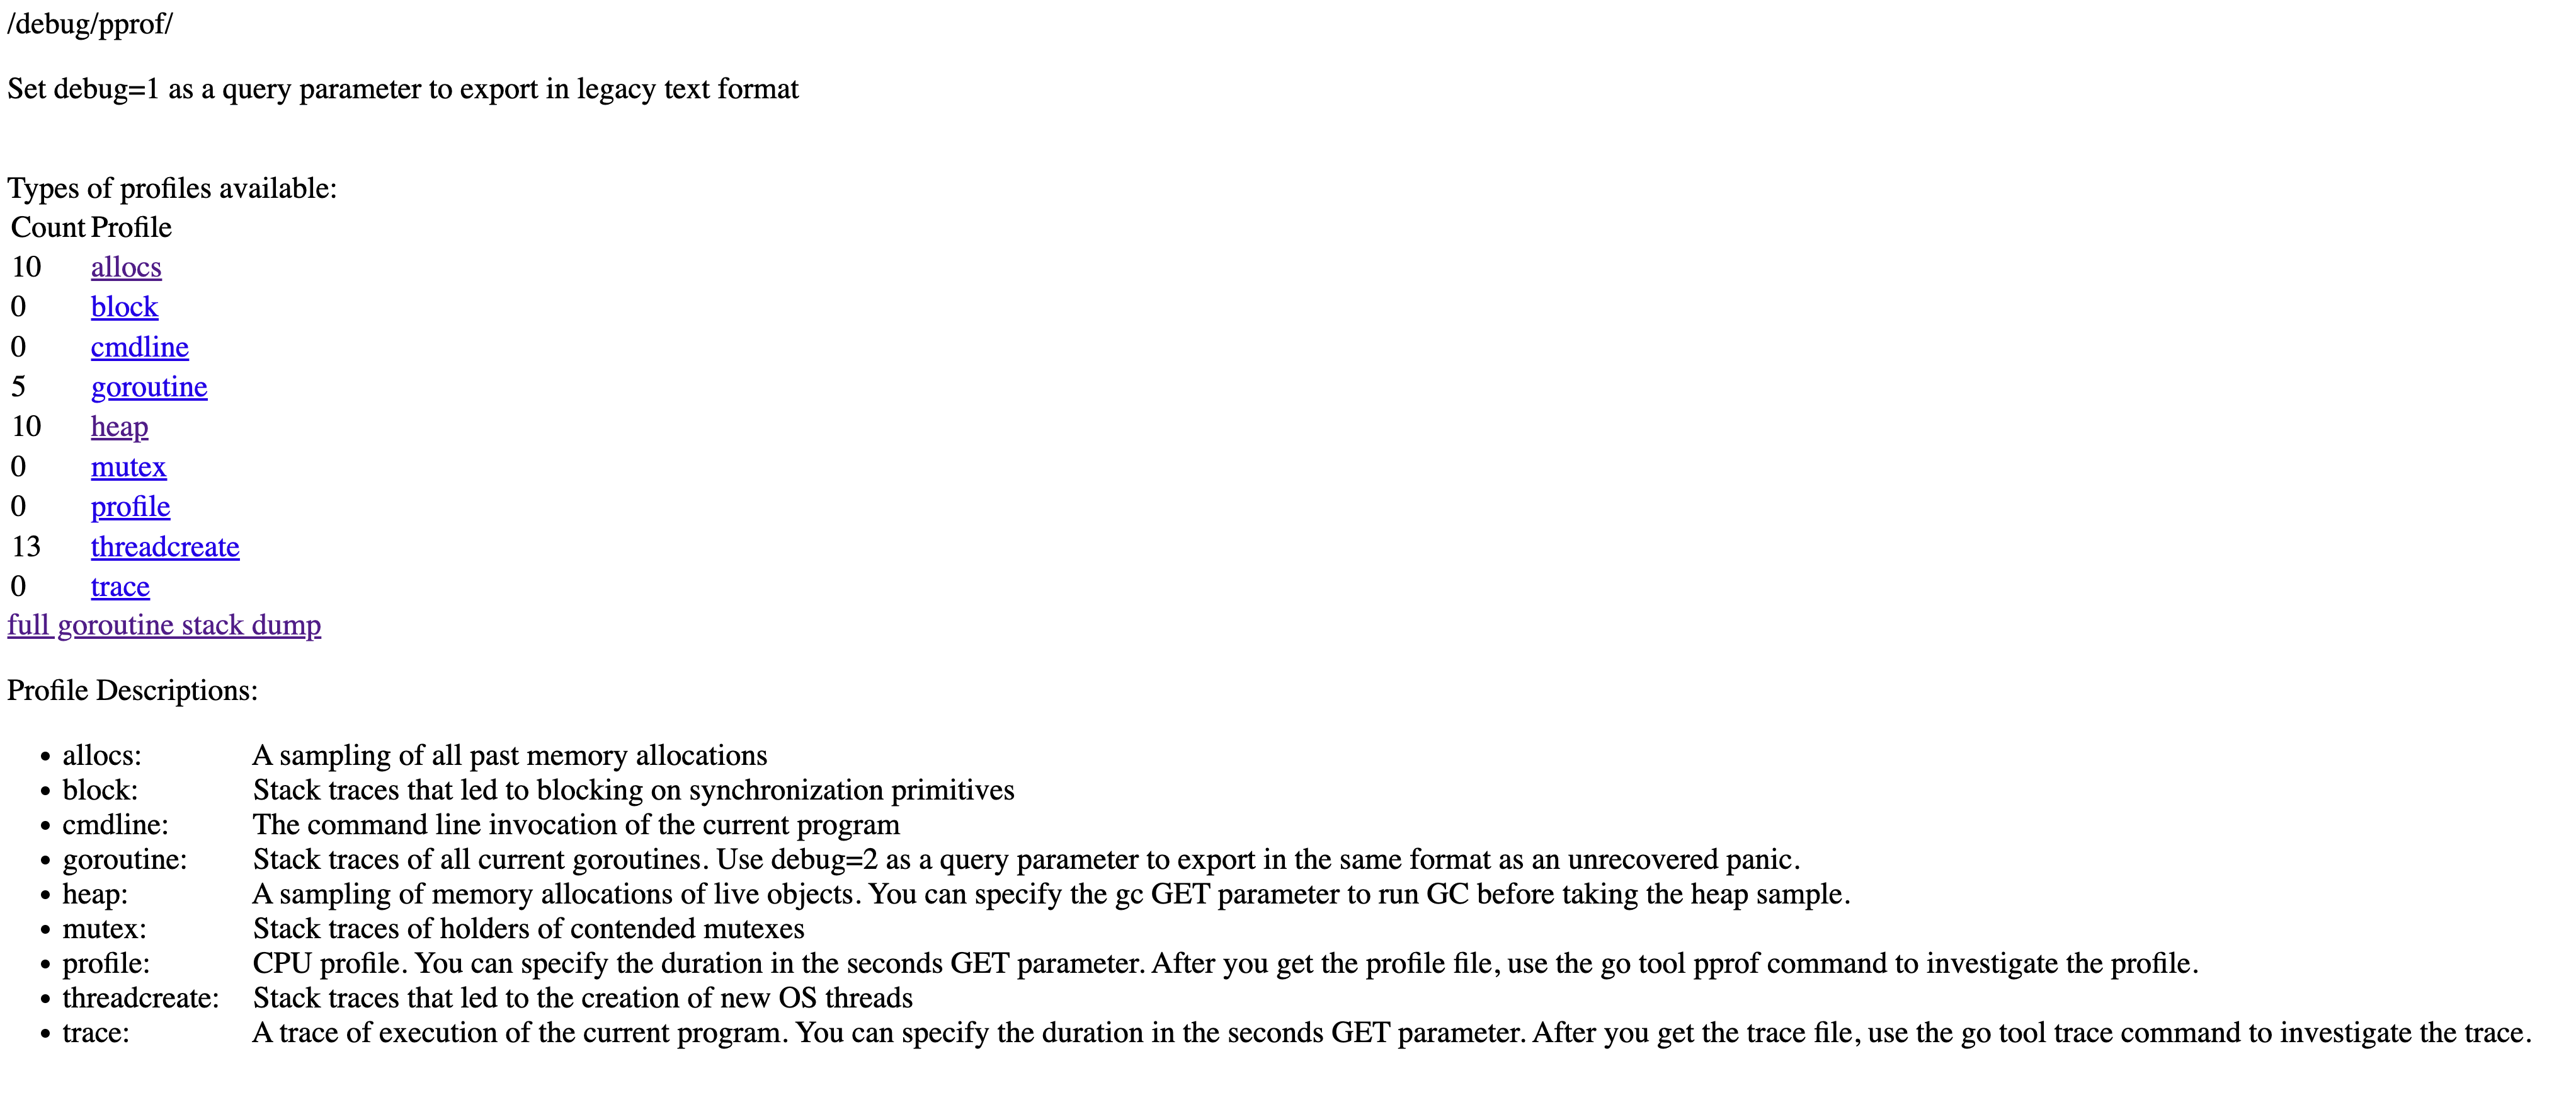
- allocs: 所有过去内存分配的采样
- block: 导致在同步原语上阻塞的堆栈跟踪
- cmdline: 当前程序的命令行调用
- goroutine: 所有当前 goroutine 的堆栈跟踪。使用 debug=2 作为查询参数,以与未恢复的 panic 相同格式导出。
- heap: 活对象内存分配的采样。您可以指定 gc GET 参数以在获取堆样本之前运行 GC。
- mutex: 被争用互斥锁持有者的堆栈跟踪
- profile: CPU 配置文件。您可以在秒数 GET 参数中指定持续时间。在获得配置文件后,使用 go tool pprof 命令来调查该配置文件。
- threadcreate: 导致创建新操作系统线程的堆栈跟踪
- trace: 当前程序执行的追踪记录。您可以在秒数 GET 参数中指定持续时间。在获得追踪文件后,使用 go tool trace 命令来调查该追踪记录。
| 类型 | 描述 |
|---|---|
| allocs | 内存分配情况的采样信息 |
| blocks | 阻塞操作情况的采样信息 |
| cmdline | 显示程序启动命令及参数 |
| goroutine | 当前所有协程的堆栈信息 |
| heap | 堆上内存使用情况的采样信息 |
| mutex | 锁争用情况的采样信息 |
| profile | CPU 占用情况的采样信息 |
| threadcreate | 系统线程创建情况的采样信息 |
| trace | 程序运行跟踪信息 |
后面是表示堆相关的内容
# runtime.MemStats
# Alloc = 247056
# TotalAlloc = 1503390952
# Sys = 1239889480
# Lookups = 0
# Mallocs = 757
# Frees = 186
# HeapAlloc = 247056
# HeapSys = 1232502784
# HeapIdle = 1231618048
# HeapInuse = 884736
# HeapReleased = 138977280
# HeapObjects = 571
# Stack = 622592 / 622592
# MSpan = 75040 / 81600
# MCache = 12000 / 15600
# BuckHashSys = 1454340
# GCSys = 3613136
# OtherSys = 1599428
# NextGC = 4194304
# LastGC = 1721651939907980000
# PauseNs = [25666 21374 27750 22292 21625 20542 29292 28042 19542 28708 22375 17500 22333 21541 40667 22833 18750 28666 59667 67917 33542 0 0 0 0 0 0 0 0 0 0 0 0 0 0 0 0 0 0 0 0 0 0 0 0 0 0 0 0 0 0 0 0 0 0 0 0 0 0 0 0 0 0 0 0 0 0 0 0 0 0 0 0 0 0 0 0 0 0 0 0 0 0 0 0 0 0 0 0 0 0 0 0 0 0 0 0 0 0 0 0 0 0 0 0 0 0 0 0 0 0 0 0 0 0 0 0 0 0 0 0 0 0 0 0 0 0 0 0 0 0 0 0 0 0 0 0 0 0 0 0 0 0 0 0 0 0 0 0 0 0 0 0 0 0 0 0 0 0 0 0 0 0 0 0 0 0 0 0 0 0 0 0 0 0 0 0 0 0 0 0 0 0 0 0 0 0 0 0 0 0 0 0 0 0 0 0 0 0 0 0 0 0 0 0 0 0 0 0 0 0 0 0 0 0 0 0 0 0 0 0 0 0 0 0 0 0 0 0 0 0 0 0 0 0 0 0 0 0 0 0 0 0 0 0 0 0 0 0 0 0 0 0 0 0 0]
# PauseEnd = [1721651939669704000 1721651939670220000 1721651939671223000 1721651939672148000 1721651939672799000 1721651939673521000 1721651939675105000 1721651939675896000 1721651939677593000 1721651939680522000 1721651939682839000 1721651939685392000 1721651939690830000 1721651939693931000 1721651939699905000 1721651939710020000 1721651939715774000 1721651939724853000 1721651939740222000 1721651939851923000 1721651939907980000 0 0 0 0 0 0 0 0 0 0 0 0 0 0 0 0 0 0 0 0 0 0 0 0 0 0 0 0 0 0 0 0 0 0 0 0 0 0 0 0 0 0 0 0 0 0 0 0 0 0 0 0 0 0 0 0 0 0 0 0 0 0 0 0 0 0 0 0 0 0 0 0 0 0 0 0 0 0 0 0 0 0 0 0 0 0 0 0 0 0 0 0 0 0 0 0 0 0 0 0 0 0 0 0 0 0 0 0 0 0 0 0 0 0 0 0 0 0 0 0 0 0 0 0 0 0 0 0 0 0 0 0 0 0 0 0 0 0 0 0 0 0 0 0 0 0 0 0 0 0 0 0 0 0 0 0 0 0 0 0 0 0 0 0 0 0 0 0 0 0 0 0 0 0 0 0 0 0 0 0 0 0 0 0 0 0 0 0 0 0 0 0 0 0 0 0 0 0 0 0 0 0 0 0 0 0 0 0 0 0 0 0 0 0 0 0 0 0 0 0 0 0 0 0 0 0 0 0 0 0 0 0 0 0 0]
# NumGC = 21
# NumForcedGC = 1
# GCCPUFraction = 0.05485177911881009
# DebugGC = false
# MaxRSS = 1126121472
记录了目前内存的情况,以及gc次数之类的信息
package main

import (
    "bytes"
    "math/rand"
    "time"
    "log"
    "net/http"
    _ "net/http/pprof"
)


func test() {

    log.Println(" ===> loop begin.")
    for i := 0; i < 1000; i++ {
        log.Println(genSomeBytes())
    }

    log.Println(" ===> loop end.")
}

//生成一个随机字符串
func genSomeBytes() *bytes.Buffer {

    var buff bytes.Buffer

    for i := 1; i < 20000; i++ {
        buff.Write([]byte{'0' + byte(rand.Intn(10))})
    }

    return &buff
}

func main() {

    go func() {
        for {
            test()
            time.Sleep(time.Second * 1)
        }
    }()

    //启动pprof
    http.ListenAndServe("0.0.0.0:10000", nil)

}
有以上代码,通过web下载pprofile文件
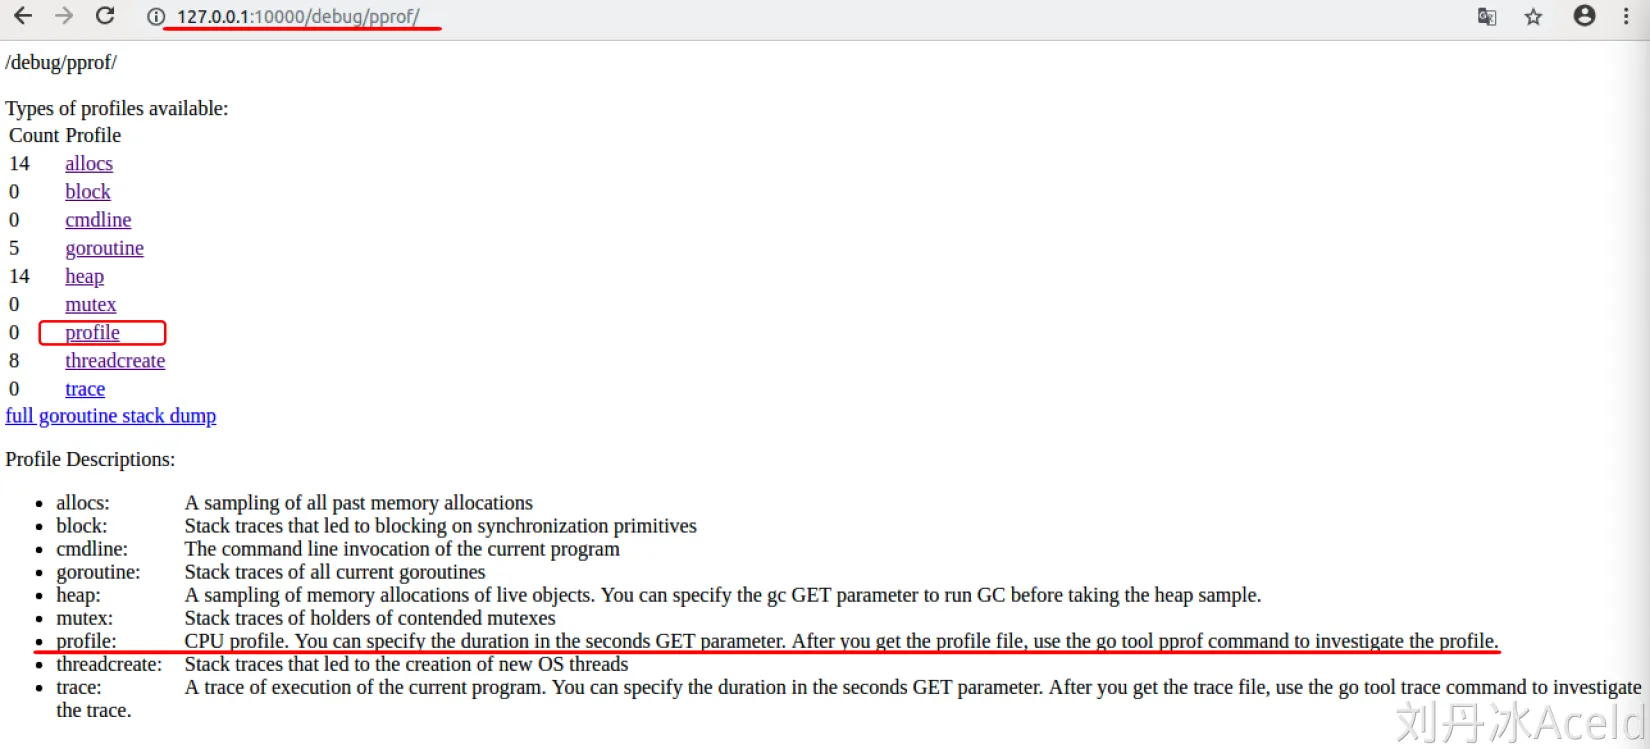
有关profile下面的英文解释大致如下:
“CPU配置文件。您可以在秒GET参数中指定持续时间。获取概要文件后,请使用go tool pprof命令调查概要文件。”
所以我们要是想得到cpu性能,就是要获取到当前进程的profile文件,这个文件默认是30s生成一个,所以你的程序要至少运行30s以上(这个参数也可以修改,稍后我们介绍)
我们可以直接点击网页的profile,浏览器会给我们下载一个profile文件. 记住这个文件的路径, 可以拷贝到与demo4所在的同一文件夹下.
pprof 的格式如下
go tool pprof [binary] [profile]
binary: 必须指向生成这个性能分析数据的那个二进制可执行文件;
profile: 必须是该二进制可执行文件所生成的性能分析数据文件。
binary 和 profile 必须严格匹配。
dorachen@Lunatic demo4 % go build
dorachen@Lunatic demo4 % ls
demo4           demo4.go        go.mod
dorachen@Lunatic demo4 % go tool pprof demo4 profile
File: demo4
Type: cpu
Time: Jul 22, 2024 at 9:04pm (CST)
Duration: 30.07s, Total samples = 3.60s (11.97%)
Entering interactive mode (type "help" for commands, "o" for options)
(pprof)
使用top命令查看cpu性能情况
(pprof) top
Showing nodes accounting for 3130ms, 86.94% of 3600ms total
Dropped 59 nodes (cum <= 18ms)
Showing top 10 nodes out of 82
      flat  flat%   sum%        cum   cum%
    2110ms 58.61% 58.61%     2110ms 58.61%  syscall.syscall
     340ms  9.44% 68.06%      340ms  9.44%  runtime.pthread_cond_wait
     130ms  3.61% 71.67%      130ms  3.61%  runtime.kevent
     120ms  3.33% 75.00%      120ms  3.33%  internal/chacha8rand.block
      90ms  2.50% 77.50%      230ms  6.39%  math/rand.(*Rand).Int31n
      90ms  2.50% 80.00%       90ms  2.50%  runtime.memmove
      80ms  2.22% 82.22%       80ms  2.22%  runtime.usleep
      60ms  1.67% 83.89%      220ms  6.11%  bytes.(*Buffer).Write
      60ms  1.67% 85.56%      290ms  8.06%  math/rand.(*Rand).Intn
      50ms  1.39% 86.94%       50ms  1.39%  runtime.pthread_cond_timedwait_relative_np
- flat:当前函数占用CPU的耗时
- flat%::当前函数占用CPU的耗时百分比
- sum%:函数占用CPU的耗时累计百分比
- cum:当前函数加上调用当前函数的函数占用CPU的总耗时
- cum%:当前函数加上调用当前函数的函数占用CPU的总耗时百分比
- 最后一列:函数名称
flat 和 cum 的区别在于,flat 只统计函数自身的 CPU 使用时间,而不包括调用子函数的时间,而 cum 则包括了函数自身的时间和调用子函数的时间。
flat% 和 cum% 则是相应的百分比表示。
sum% 表示当前函数及其子函数的 CPU 使用时间占总时间的百分比,是在 cum% 的基础上,去掉了当前函数的父函数的 CPU 使用时间。
也可以通过go tool pprof得到profile文件
我们上面的profile文件是通过web浏览器下载的,这个profile的经过时间是30s的,默认值我们在浏览器上修改不了,如果你想得到时间更长的cpu利用率,可以通过go tool pprof指令与程序交互来获取到
启动程序后通过以下命令 给profile设置seconds时间 等到60s后会有结果
go tool pprof "http://localhost:10000/debug/pprof/profile?seconds=60"
会下载到/home/pprof下(采样60s)
也可以直接
go tool pprof http://10.128.201.131:6060/debug/pprof/mutex
等命令,可以拿到从开始到现在所有时间长度的数据并且自动保存到home/pprof下
查看具体函数(精确到语句的)CPU执行情况
list 函数名就可以查看具体
**(pprof) list main**
Total: 8.26s
ROUTINE ======================== main.genSomeBytes in /Users/dorachen/go_project/src/go-dlv-pprof/memory_debug/demo4/demo4.go
      70ms      1.42s (flat, cum) 17.19% of Total
         .          .     23:func genSomeBytes() *bytes.Buffer {
         .          .     24:
         .       10ms     25:   var buff bytes.Buffer
         .          .     26:
      20ms       20ms     27:   for i := 1; i < 20000; i++ {
      10ms      1.35s     28:           buff.Write([]byte{'0' + byte(rand.Intn(10))})
         .          .     29:   }
         .          .     30:
      40ms       40ms     31:   return &buff
         .          .     32:}
         .          .     33:
         .          .     34:func main() {
         .          .     35:
         .          .     36:   go func() {
ROUTINE ======================== main.main.func1 in /Users/dorachen/go_project/src/go-dlv-pprof/memory_debug/demo4/demo4.go
         0      6.09s (flat, cum) 73.73% of Total
         .          .     36:   go func() {
         .          .     37:           for {
         .      6.09s     38:                   test()
         .          .     39:                   time.Sleep(time.Second * 1)
         .          .     40:           }
         .          .     41:   }()
         .          .     42:
         .          .     43:   //启动pprof
ROUTINE ======================== main.test in /Users/dorachen/go_project/src/go-dlv-pprof/memory_debug/demo4/demo4.go
         0      6.09s (flat, cum) 73.73% of Total
         .          .     12:func test() {
         .          .     13:
         .          .     14:   log.Println(" ===> loop begin.")
         .          .     15:   for i := 0; i < 1000; i++ {
         .      6.09s     16:           log.Println(genSomeBytes())
         .          .     17:   }
         .          .     18:
         .          .     19:   log.Println(" ===> loop end.")
         .          .     20:}
         .          .     21:
ROUTINE ======================== main.test.Println.func2 in /usr/local/go/src/log/log.go
         0       30ms (flat, cum)  0.36% of Total
         .          .    405:   std.output(0, 2, func(b []byte) []byte {
         .       30ms    406:           return fmt.Appendln(b, v...)
         .          .    407:   })
         .          .    408:}
         .          .    409:
         .          .    410:// Fatal is equivalent to [Print] followed by a call to [os.Exit](1).
         .          .    411:func Fatal(v ...any) {

**(pprof) list test**
Total: 8.26s
ROUTINE ======================== main.test in /Users/dorachen/go_project/src/go-dlv-pprof/memory_debug/demo4/demo4.go
         0      6.09s (flat, cum) 73.73% of Total
         .          .     12:func test() {
         .          .     13:
         .          .     14:   log.Println(" ===> loop begin.")
         .          .     15:   for i := 0; i < 1000; i++ {
         .      6.09s     16:           log.Println(genSomeBytes())
         .          .     17:   }
         .          .     18:
         .          .     19:   log.Println(" ===> loop end.")
         .          .     20:}
         .          .     21:
ROUTINE ======================== main.test.Println.func2 in /usr/local/go/src/log/log.go
         0       30ms (flat, cum)  0.36% of Total
         .          .    405:   std.output(0, 2, func(b []byte) []byte {
         .       30ms    406:           return fmt.Appendln(b, v...)
         .          .    407:   })
         .          .    408:}
         .          .    409:
         .          .    410:// Fatal is equivalent to [Print] followed by a call to [os.Exit](1).
         .          .    411:func Fatal(v ...any) {
可视化查看
在pprof命令里面输入web,会生成svg
或者go tool pprof -http=:9988 profile.prof 对于不同的profile会出现一个web页面